Anti-SARS-CoV-2 enzyme immunoassays evaluation: Diagnostic characteristics and detection of cross-reactivity in Brazilian samples
Avaliação de imunoensaios enzimáticos anti-SARS-CoV-2: características diagnósticas e detecção de reatividade cruzada em amostras brasileiras
Lucas Bochnia-Bueno1, Sergio Monteiro De-Almeida2, Meri Bordignon Nogueira2, Sonia Mara Raboni1
1 Universidade Federal do Paraná, Laboratório de Virologia – Curitiba – Paraná e Universidade Federal do Paraná, Programa de Pós-Graduação em Microbiologia, Parasitologia e Patologia. Curitiba, PR, Brasil.
2 Universidade Federal do Paraná, Laboratório de Virologia. Curitiba, PR, Brasil.
Recebido em 07/12/2021
Aprovado em 06/07/2022
DOI: 10.21877/2448-3877.202200007
INTRODUCTION
The SARS-CoV-2 pandemic presents many significant diagnostic challenges because it is a new pathogen.(1) Serology tests to detect the presence of antibodies to SARS-CoV-2 aim to identify the previous infection, and to confirm the presence of current infection.(1) SARS-CoV-2 serology testing relies on targeted antibodies binding to SARS-CoV-2 specific antigens.
This study aimed to assess the diagnostic performance of Enzyme-Linked Immunosorbent Assay (ELISA) of three different manufactures and compare them with molecular test (definite) or the clinical defined test (probable) in individuals with SARS-CoV-2 infection.
METHODS
The samples consisted of serum specimens sent to the Virology Laboratory, Hospital de Clínicas, Universidade Federal do Paraná (HC-UFPR), Brazil. Immunological and RT-qPCR for SARS-CoV-2 assays were performed in the HC-UFPR virology laboratory, certified by the Health Secretary of Paraná, Brazil. This study was approved under a waiver of informed consent by the HC-UFPR institutional review board, Brazil (CAAE: 30578620.7.0000.0008).
Patients admitted to the HC-UFPR between March 1st and August 7th, 2020, were eligible if they had respiratory symptoms suspicious of COVID-19. The performances of the three different ELISAs were evaluated in serum samples obtained on corresponding dates that respiratory specimens were collected for molecular test. A total of 105 serum samples were randomly selected for convenience and distributed in the following groups:
Group with SARS-CoV-2 (COVID-19, n=66)
Group 1 (G1): Definite SARS-CoV-2 infection (n= 54), patients who tested positive for SARS-CoV-2 on RT-qPCR from nasopharyngeal samples. Participants admitted to the hospital COVID-19 unit or intensive care unit (ICU), n=23 (42.59%); outpatients (n=31; 57.41%); male 27 (50%); median (IQR) of age was 48.48 (44.14; 52.81) years old; time after symptoms onset 15.67 (13.20; 18.14) days. Two participants (3.7%) were asymptomatic.
Group 2 (G2): Probable SARS-CoV-2 infection (n= 12), patients who tested RT-qPCR negative for SARS-CoV-2 on nasopharyngeal samples, but fulfilled the World Health Organization (WHO) clinical diagnostic case definitions for SARS-CoV-2.(2) All participants admitted in the hospital COVID-19 unit or intensive care unit (ICU); male 6 (50%); median (IQR) of age was 61.5 (47.5, 74.5) years old; time after symptoms onset 11 (7.5; 19) days.
Group with other diseases (n= 23), or RT-qPCR for SARS-CoV-2 on nasopharyngeal samples negative
Group 3 (G3): Severe acute respiratory syndrome (SARS), RT-qPCR for SARS-CoV-2 on respiratory samples were either negative or did not fulfill the WHO case definitions for SARS-CoV-2(2) or other etiologies were identified (n= 14).
Group 4 (G4): Other viruses were identified (n= 9), by RT-qPCR on a nasopharyngeal swab tested against a respiratory virus panel, Rhinovirus (n=7) and Coronavirus 229e/NL63 (1 case). The ninth case was positive for Mycobacterium tuberculosis and was included in this group because it also affects the respiratory tract.
Healthy control, n=16
Group 5 (G5): Serum samples from 16 blood donors were collected in 2015 (HIV, HCV, HBV, HTLV I/II, syphilis, and Chagas disease negative, and without respiratory symptoms). This group was not tested for SARS-CoV-2 by RT-qPCR as the samples were taken before the emergence of the virus in China(2) and was the available samples for the analyses.
Enzyme-Linked Immunosorbent Assays (ELISAs)
The kits used were ERBALisa® COVID-19 IgM/IgG (Calbiotech, El Cajon, CA, USA); Biolisa COVID-19 IgM/IgG (Bioclin, Quibasa, Brazil); and Allserum EIA COVID-19 IgM/IgG (MBiolog, Minas Gerais, Brazil), all of them were capture reaction to detect SARS-CoV-2 IgM or IgG in serum/plasma samples. All blood samples were centrifuged and kept frozen at least -20ºC until the moment of use. Multiple thawing cycles were avoided. These were thawed once for analysis and kept refrigerated until complete analysis. Samples with a pattern of hemolysis were noted.
Samples were tested in parallel in the three assays. The tests were performed in duplicate at room temperature according to the manufacturer’s instructions. The number of samples tested on each day was previously divided so that each analysis presented samples from the five groups, avoiding the segregation of any possible error. Each group of samples was kept refrigerated at approximately 4ºC in the period between the IgM analysis and the IgG analysis, this period being up to 24 hours.
For all tests, the recommended dilution (1:101 for Biolisa and Allserum; 1:21 for ERBALisa) of samples were performed and 100µL of the diluted was pipetted into the respective reaction well. After following incubation and washing steps, the sample was read in the proper spectrophotometer for reading ELISA tests in the wavelengths of 450nm and 640nm. The index value was calculated as recommended by the manufacturer. Index values for both immunoglobulins, less than 0.79 represented negative samples, while index values between 0.80 and 1.09 represented indeterminate samples, and index values superior than 1.10 represented positive samples.
RT-qPCR for SARS-CoV-2
Nasopharyngeal samples were collected with a rayon swab and transported immediately to the virology laboratory in a viral transport medium (VTM). The RT-qPCR was previous carried using the XGEN-Master COVID-19 (XGEN) for the qualitative detection of nucleic acid in RT-qPCR format-reverse transcription, followed by amplification of a conserved region of the ORF1ab and N genes for SARS-CoV-2.(3) using specific primers and a fluorescence-labeled probe in respiratory samples.
Statistical Analyses
Statistical tests were performed using the GraphPad Prism version 9.0.0, in which quantitative data were submitted to a non-parametric t-test (Mann-Whitney), and qualitative data were analyzed using the Chi-square test, as appropriated. Valuesof p<0.05 were set as statistically significant. Duplicates that showed a coefficient of variation greater than 20.0% were disregarded and repeated. Receiver operating characteristics (ROC) curves were constructed to assess the kits’ overall diagnostic information by comparing the areas under the curve (AUC).
Operational characteristics of the tests were evaluated for each kit. The RT-qPCR for SARS-CoV-2 was the reference method. We analyzed together with the diagnostic performance for the detection of IgM, IgG, IgM and/or IgG antibodies in each test. The analyzes were performed using the MedCalc platform (https://www.medcalc.org/calc/diagnostic_test.php), considering different gold standard scenarios: (1) Definite disease and (2) Definite disease + Probable disease.
The following clinical performance measures were calculated: sensitivity; specificity; accuracy (efficiency); positive and negative predictive values (PPV, NPV); Youden index;(4) positive and negative clinical utility index (CUI+, CUI−). The CUI values were classified as follows: excellent, ≥0.81; good, ≥0.64; fair, ≥0.49; poor, ≤0.49; and very poor, ≤0.36.(5,6) We calculated the positive and negative likelihood ratio (LR+, LR−) and diagnostic odds ratio (DOR), in which an LR+ value ≥ 10.0 indicates that a positive test almost confirmed the disease, a value of ~6.0 indicates that the disease was present, and a value of ~1.0 indicates that the test was not able to show whether the disease was present or not. An LR+ value ≤ 0.1 indicates that the disease was practically absent.(7,8) We carried out the comparison of concordance and discordance proportions of the different kits with the Matthews Correlation Coefficient, which is a value between −1 and +1, values close to +1 describes a perfect prediction, values close to 0 does not give any valid information and values close to -1 represent a complete inconsistency between prediction and outcome.
Positive rates and levels of agreement between the kits were assessed using Cohen’s Kappa coefficients of agreement, which is interpreted as follows: values ≤ 0 as indicating no agreement (i.e., purely random), 0.01-0.20 as none to slight, 0.21-0.40 as fair, 0.41- 0.60 as moderate, 0.61-0.80 as substantial, and 0.81-1.00 as almost perfect agrément.(9)
RESULTS
The groups with definite and probable SARS-CoV-2 infection were comparable regarding time to onset of symptoms and age.
Operational characteristics of ELISAs
Overall, the analysis of the tests showed acceptable sensitivity; ERBALisa presented the best sensitivity result in IgM and combined tests, despite being the test with less accuracy. However, the Biolisa and Allserum tests showed lower sensitivity values in the combined analysis (Figure 1A). Biolisa and Allserum presented higher specificity (Figure 1B) and accuracy, with less extended 95% confidence intervals (Table 1).
Considering IgG + IgM or IgM or IgG for the diagnoses of definite or probable SARS-CoV-2 infection, the three kits showed fair diagnostic performance characteristics. The higher sensitivity was for ERBALisa in the IgM and IgG combination results (IgM+IgG), the accuracy was similar for ERBALisa, Biolisa and Allserum. Diagnostic specificity was 100% for the Allserum (IgG). LR+ was closer than 30 for the Allserum (IgG – G1 vs. G3+G4+G5), indicating a positive test almost confirm the SARS-CoV-2 infection. The highest DOR was seen in IgG and IgM+IgG from the Allserum test (Table 1).
For the RT-qPCR+ group (G1), the sensitivity and accuracy were higher for all the brands evaluated. Although for the probable SARS-CoV-2 infection (RT-qPCR negative), all of them showed a limited value for IgM and IgG, but high specificity (Table 1).
Concerning the detection of IgM for the diagnoses of definite or probable SARS-CoV-2 infection, ERBALisa and Biolisa displayed higher sensitivity and accuracy, respectively. Only ERBALisa showed lower diagnostic specificity for IgM detection (Table 1). Concerning the detection of the IgG for SARS-CoV-2, the sensitivity was fair, although it had high specificity; the Biolisa and Allserum showed similar diagnostic performance characteristics (Table 1).
Two participants (3.7%) at G1 were asymptomatic and were positive for SARS-CoV-2 RT-qPCR; only one of them tested positive for IgM in all brands, the other tested negative for IgM in ERBALisa and Allserum, and undetected in Biolisa. The IgG was positive in all assays performed in both cases.
Uncorrelated ROC curves IgM (Figure 2A) and IgG (Figure 2B) were generated using data from different groups of patients (G1 vs. G3+G4+G5 or G1+G2 vs. G3+G4+G5 or G2 vs. G3+G4+G5) where patients within each group are subjected to other diagnostic tests, as RT-qPCR; the results are shown in Table 2.
The agreement between ELISA kits by the Cohen’s Kappa was almost perfect only between the Biolisa and Allserum kits (index: 0.81-1.00) under IgM, IgG, and IgM or IgG comparison (Table 3).
Analytical specificity (cross-reaction)
For the IgM tests, ERBALisa cross-reacted with 7 samples (2 Dengue virus, 1 Syphilis, 1 Rhinovirus, 1 multiple infection – HIV, hepatitis A and B -, and 2 healthy group samples) resulting in analytical specificity equal to 76.92%; Biolisa and Allserum cross-reacted with the same sample (1 healthy group sample) resulting in analytical specificity equal to 97.44% for both. For IgG, Allserum did not cross-reacted (analytical specificity: 100%); ERBALisa cross-reacted with 2 samples (2 positives for Dengue virus) resulting in analytical specificity equal to 94.87%; and Biolisa cross-reacted with 2 samples (1 Rhinovirus, and 1 healthy group sample) resulting in analytical specificity equal to 94.87%.
Analytical interference
A total of 10 (9.53%) samples were hemolyzed, but there was no interference in the results obtained.
Table 1
Diagnostic characteristics of the ELISA tests evaluated considering separate IgM and IgG diagnosis and the combined diagnosis. Values are presented for patients with definite disease and patients with definite and probable disease.
| Pos: G1; Neg: G3, G4, G5 | ERBALisa® | BIOLISA | ALLSERUM | |||||||
| Statistic value (CI 95%) | IgM | IgG | IgM/IgG | IgM | IgG | IgM/IgG | IgM | IgG | IgM/IgG | |
| Sensitivity (%) | 51.85 (37.84-65.66) |
50.00 (36.08-63.92) |
74.07 (60.35-85.04) |
48.15 (34.34-62.16) |
68.52 (54.45-80.48) |
72.22 (58.36-83.54) |
40.74 (27.57-54.97) |
68.52 (54.45-80.48) |
70.37 (56.39-82.02) |
|
| Specificity (%) | 76.92 (60.67-88.87) |
94.87 (82.68-99.37) |
82.05 (66.47-92.46) |
97.44 (86.52-99.94) |
94.87 (82.68-99.37) |
92.31 (79.13-98.38) |
97.44 (86.52-99.94) |
100.00 (90.97-100.00) |
97.44 (86.52-99.94) |
|
| Positive Likelihood Ratio | 2.25 (1.20-4.21) |
9.75 (2.46-38.60) |
4.13 (2.07-8.22) |
18.78 (2.66-132.57) |
13.36 (3.42-52.16) |
9.39 (3.13-28.20) |
15.89 (2.24-112.94) |
27.44 (3.93-191.44) |
||
| Negative Likelihood Ratio | 0.63 (0.45-0.87) |
0.53 (0.40-0.69) |
0.32 (0.20-0.51) |
0.53 (0.41-0.69) |
0.33 (0.22-0.50) |
0.30 (0.19-0.47) |
0.61 (0.48-0.76) |
0.31 (0.21-0.47) |
0.30 (0.20-0.46) |
|
| Positive Predictive Value (%) | 75.68 (62.41-85.36) |
93.10 (77.32-98.16) |
85.11 (74.15-91.93) |
96.30 (78.65-99.46) |
94.87 (82.57-98.63) |
92.86 (81.23-97.50) |
95.65 (75.58-99.36) |
100.00 | 97.44 (84.49-99.62) |
|
| Negative Predictive Value (%) | 53.57 (45.44-61.51) |
57.81 (50.96-64.37) |
69.57 (58.72-78.60) |
57.58 (51.08-63.82) |
68.52 (59.33-76.46) |
70.59 (60.73-78.83) |
54.29 (48.62-59.84) |
69.64 (60.75-77.27) |
70.37 (61.08-78.23) |
|
| Positive Clinical Utility Index | 0.39 (0.22-0.56) |
0.47 (0.30-0.63) |
0.63 (0.49-0.77) |
0.46 (0.29-0.63) |
0.65 (0.51-0.79) |
0.67 (0.54-0.80) |
0.39 (0.21-0.57) |
0.68 (0.56-0.81) |
0.69 (0.56-0.81) |
|
| Negative Clinical Utility Index | 0.41 (0.30-0.52) |
0.55 (0.45-0.64) |
0.57 (0.46-0.68) |
0.56 (0.47-0.65) |
0.65 (0.56-0.74) |
0.65 (0.56-0.75) |
0.53 (0.44-0.62) |
0.70 (0.61-0.78) |
0.69 (0.6-0.77) |
|
| Accuracy (%) | 62.37 (51.72-72.21) |
68.82 (58.37-78.02) |
77.42 (67.58-85.45) |
68.82 (58.37-78.02) |
79.57 (69.95-87.23) |
80.65 (71.15-88.11) |
64.52 (53.91-74.17) |
81.72 (72.35-88.98) |
81.72 (72.35-88.98) |
|
| Youden index | 0.29 (0.00-0.54) |
0.45 (0.19-0.63) |
0.56 (0.27-0.77) |
0.46 (0.21-0.62) |
0.63 (0.37-0.80) |
0.64 (0.37-0.82) |
0.38 (0.14-0.55) |
0.68 (0.45-0.80) |
0.68 (0.43-0.82) |
|
| Diagnostic Odds Ratio | 3.59 (1.44-8.98) |
18.50 (4.05-84.55) |
13.06 (4.71-36.20) |
35.29 (4.51-275.78) |
40.27 (8.68-186.77) |
31.20 (8.34-116.77) |
26.12 (3.33-204.67) |
169.29 (9.83-2916.28) |
90.25 (11.39-715.04) |
|
| Matthews correlation coefficient | 0.27 | 0.47 | 0.44 | 0.48 | 0.54 | 0.52 | 0.46 | 0.58 | 0.57 | |
| Pos: G1,G2; Neg: G3, G4, G5 | ||||||||||
| Sensitivity (%) | 42.42 (30.34-55.21) |
45.45 (33.14-58.19) |
65.15 (52.42-76.47) |
39.39 (27.58-52.19) |
57.58 (44.79-69.66) |
60.61 (47.81-72.42) |
33.33 (22.20-46.01) |
57.58 (44.79-69.66) |
59.09 (46.29-71.05) |
|
| Specificity (%) | 76.92 (60.67-88.87) |
94.87 (82.68-99.37) |
82.05 (66.47-92.46) |
97.44 (86.52-99.94) |
94.87 (82.68-99.37) |
92.31 (79.13-98.38) |
97.44 (86.52-99.94) |
100.00 (90.97-100.00) |
97.44 (86.52-99.94) |
|
| Positive Likelihood Ratio | 1.84 (0.97-3.48) |
8.86 (2.24-35.08) |
3.63 (1.81-7.26) |
15.36 (2.17-108.82) |
11.23 (2.87-43.99) |
7.88 (2.61-23.78) |
13.00 (1.82-92.71) |
23.05 (3.29-161.19) |
||
| Negative Likelihood Ratio | 0.75 (0.57-0.98) |
0.57 (0.46-0.73) |
0.42 (0.30-0.61) |
0.62 (0.51-0.76) |
0.45 (0.33-0.60) |
0.43 (0.31-0.58) |
0.68 (0.57-0.82) |
0.42 (0.32-0.56) |
0.42 (0.31-0.56) |
|
| Positive Predictive Value (%) | 75.68 (62.17-85.49) |
93.75 (79.13-98.34) |
86.00 (75.43-92.48) |
96.30 (78.59-99.46) |
95.00 (82.90-98.67) |
93.02 (81.54-97.57) |
95.65 (75.52-99.37) |
100.00 | 97.50 (84.79-99.63) |
|
| Negative Predictive Value (%) | 44.12 (37.62-50.82) |
50.68 (44.90-56.45) |
58.18 (49.23-66.63) |
48.72 (43.72-53.74) |
56.92 (49.71-63.86) |
58.06 (50.32-65.43) |
46.34 (41.95-50.79) |
58.21 (51.26-64.85) |
58.46 (51.18-65.39) |
|
| Positive Clinical Utility Index | 0.32 (0.16-0.49) |
0.43 (0.27-0.58) |
0.56 (0.42-0.70) |
0.38 (0.21-0.54) |
0.55 (0.41-0.69) |
0.56 (0.43-0.70) |
0.32 (0.15-0.49) |
0.58 (0.44-0.71) |
0.58 (0.44-0.71) |
|
| Negative Clinical Utility Index | 0.34 (0.23-0.45) |
0.481 (0.39-0.57) |
0.48 (0.37-0.59) |
0.47 (0.38-0.57) |
0.54 (0.44-0.63) |
0.54 (0.44-0.63) |
0.45 (0.36-0.54) |
0.58 (0.49-0.67) |
0.57 (0.48-0.66) |
|
| Accuracy (%) | 55.24 (45.22-64.95) |
63.81 (53.85-72.96) |
71.43 (61.79-79.82) |
60.95 (50.95-70.33) |
71.43 (61.79-79.82) |
72.38 (62.80-80.66) |
57.14 (47.11-66.76) |
77.00 (67.51-84.83) |
73.33 (63.81-81.49) |
|
| Youden index | 0.19 (0.00-0.44) |
0.40 (0.16-0.58) |
0.47 (0.19-0.69) |
0.37 (0.14-0.52) |
0.52 (0.27-0.69) |
0.53 (0.27-0.71) |
0.30 (0.09-0.46) |
0.58 (0.36-0.70) |
0.56 (0.33-0.71) |
|
| Diagnostic Odds Ratio | 2.46 (1.01-5.98) |
15.42 (3.43-69.31) |
8.55 (3.27-22.36) |
24.70 (3.19-191.12) |
25.11 (5.58-113.01) |
18.46 (5.15-66.21) |
19.00 (2.44-147.67) |
106.72 (6.30-1810.37) |
54.89 (7.10-424.40) |
|
| Matthews correlation coefficient | 0.20 | 0.42 | 0.47 | 0.41 | 0.52 | 0.52 | 0.36 | 0.58 | 0.56 | |

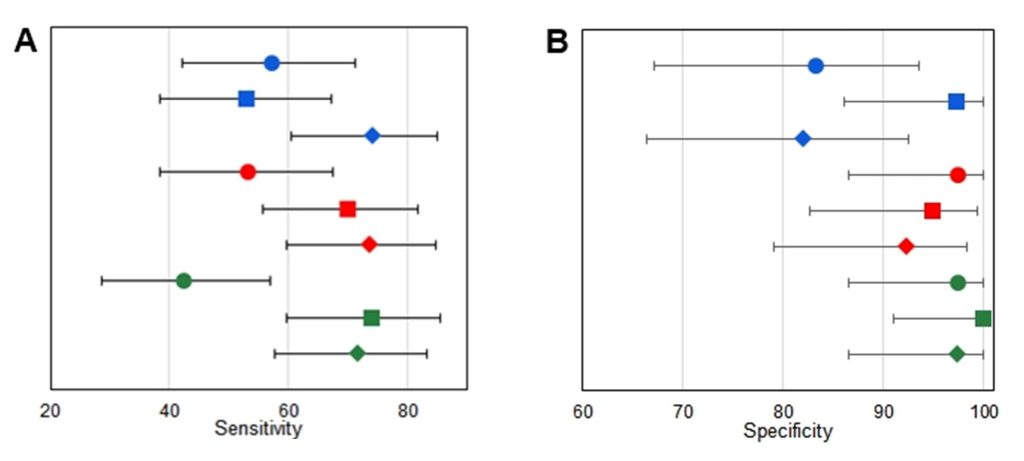
Figure 1
Analytical results for each manufacturer. A. Sensitivity for each manufacturer for diagnosis of SARS-CoV-2 in the groups with definite disease. B. Specificity of each manufacturer for diagnosis of SARS-CoV-2 in the groups with definite disease. Circles represent IgM results; blocks represent IgG results, and diamonds represent IgM+IgG results. Symbols, lines, or circles: blue, ERBALisa® COVID-19; green, Allserum EIA COVID-19; red, Biolisa COVID-19.
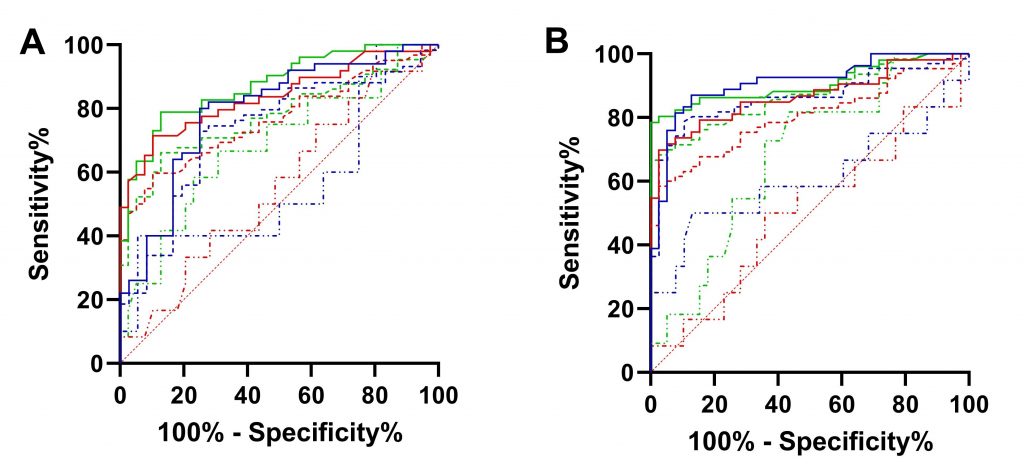
Figure 2
ROC Curve for IgM/IgG. A. ROC curve for IgM results for each manufacturer. B. ROC curve for IgG results for each manufacturer. Continuous line, group 1; thick dotted, groups 1 and 2; and thin dotted line, group 2. Lines: blue, ERBALisa® COVID-19; green, Allserum EIA COVID-19; red, Biolisa COVID-19.
Table 2
Comparison between the area under the curve (AUC) calculated in the ROC curve for IgM and IgG tests for the different tests evaluated obtained for each group of patients.
| IgM | IgG | |||||
| ERBALisa® COVID-19 | Biolisa COVID-19 | Allserum EIA COVID-19 | ERBALisa® COVID-19 | Biolisa COVID-19 | Allserum EIA COVID-19 | |
| Group 1 | 0.79
(0.69 to 0.89) p<0.0001 |
0.84
(0.76 to 0.92) p<0.0001 |
0.88
(0.81 to 0.94) |
0.91
(0.85 to 0.97) p<0.0001 |
0.88
(0.79 to 0.94) p<0.0001 |
0.91
(0.84 to 0.97) p<0.0001 |
| Group 1+2 | 0.73
(0.63 to 0.84) p=0.0002 |
0.76
(0.67 to 0.85) p<0.0001 |
0.77
(0.69 to 0.86) p<0.0001 |
0.86
(0.79 to 0.93) p<0.0001 |
0.80
(0.72 to 0.88) p<0.0001 |
0.87
(0.80 to 0.97) p<0.0001 |
| Group 2 | 0.56
(0.34 to 0.79) p=0.540 |
0.56
(0.37 to 0.74) p=0.556 |
0.68
(0.50 to 0.87) p=0.058 |
0.61
(0.38 to 0.83) p=0.271 |
0.51
(0.31 to 0.71) p=0.947 |
0.68
(0.51 to 0.85) p=0.068 |
Note: p value less than 0.05 represents statistical difference between the AUC and the baseline (random classifier).
Table 3
Kappa index for the ELISA kits tested
| Reactives | IgM | IgG | IgM/IgG |
| ErbaLisa® x Biolisa | 0.649** | 0.538* | 0.612** |
| ErbaLisa® x Allserum | 0.627** | 0.695** | 0.708** |
| Biolisa x Allserum | 0.919*** | 0.871*** | 0.858*** |
Note: *- Moderate agreement. **- Substantial agreement. ***- Almost perfect agreement
DISCUSSION
We report the operational characteristics of the ELISA for IgM, IgG, and IgM or IgG anti-SARS-CoV-2 from three different manufacturers for IgG and IgM anti-SARS-CoV-2, which showed variability in the performance of these tests, mainly comparing sensitivity and specificity values that ranged from 33.33% to 74.07% for sensibility, and 76.92% to 100.00 for specificity. The best results were observed when IgM and IgG were analyzed together, suggesting that the separate detection of these antibodies may have a poor correlation with the presence of disease.
The diagnosis of SARS-CoV-2 infection involves collecting the correct specimen at the right time. IgM antibodies usually appear after the seventh day of the infection, indicating acute infection. Whereas IgG antibodies appear from the fourteenth day on. However, the usefulness of monitoring IgM and discriminating them from IgG is largely debated.(1,10)
Overall, the ELISA to identify SARS-CoV-2 antibodies (IgM, IgG) in the definite and probable cases showed fair sensitivity, and high specificity, and PPV. This indicates that a positive result is often seen in those with SARS-CoV-2 infection, and a negative result needs confirmation by clinical or other diagnostic methods to exclude the infection. The high PPV indicates that a false positive is rare, and suggests it can be a potential confirmatory test. The CUI+ values suggested ELISA are great for case finding, and a CUI- is good for screening. The overall value of this single test for combined screening and case finding is good. The clinical performance characteristics presented higher values considering only the definite SARS-CoV-2 cases determined by positive RT-qPCR. However, for probable cases, the clinical performance characteristics showed limited values. Overall, the manufacturers, diagnostic sensitivity, DOR and MCC of IgG were higher than IgM, and the diagnostic specificity was similar for IgM and IgG.
All serum test presented the best clinical performance characteristic, followed by the Biolisa. Our findings are in accordance with previous studies, in which the Allserum test showed in this studies, estimates of sensitivity for IgG (66.9%; 95% CI 58.8-74.1%) and specificity (98.1%; 95% CI 93.4-99.5%), and sensitivity for IgM (50.7; 95% CI 42.6-58.8%).(11,12,13) Biolisa and ERBALisa® did not present previous reports. The Youden´s index, accuracy and MCC of IgG were similar for the Allserum and Biolisa manufacturers, ERBALisa® showed lower results.
Test performance characteristics as provided by manufacturers were similar to those observed in our study, except the sensibility for all manufacturers, has also presented by Zhang et al.(14) with many others ELISA tests. In the present study, the median time after the symptoms appeared was 11 and 17 days in the groups with definite and probable SARS-CoV-2, and the positivity of immunological tests for SARS-CoV-2 diagnosis is time-dependent. Patients with at least 8 days of symptoms presented a higher sensitivity.(15,16) Antibody-mediated immunity in SARS-CoV-2 specific IgM and IgG are detectable in the serum between 7 and 14 days after the onset of the symptoms, respectively. The SARS-CoV-2 Virus RNA peak occurs at 3-5 days after exposure; virus RNA inversely correlated with neutralizing antibody titers. In the acute phase of the disease, nucleic acid detection of SARS-CoV-2 in respiratory samples was greater than antibody detection in the diagnosis of COVID-19.(15,17,18) After that period, tests that detect the presence of specific antibodies are recommended.(10,19) Antibody tests could play a useful role in the detection of previous SARS-CoV-2 infection if applied 15 or more days after the onset of symptoms. The persistence of antibody rises is currently unknown, as there is very little data beyond 35 days post-symptoms onset(1) as well as about the extension of protection of neutralizing antibodies against subsequent infection with the virus.(20) The sensitivity of ELISA to SARS-CoV-2, in general it is 20.8% (95% CI = 9.2-40.4%) from the 1st to the 7th day after the onset of the symptoms; 54.9% (95% CI = 43.4-65.9%) from the 8th to the 14th days and 78.9% (95% CI = 68.1-86.8%) from day 15 after the onset of the symptoms.(21)
Our study will add to the previous ones(1,14,21) as SARS-CoV-2 infection cases were based on RT-qPCR and clinical radiologic criteria, i.e., definite and probable SARS-CoV-2 cases, respectively;(2) a total of 18% of the samples included in the SARS-CoV-2 group were probable infection. Although these cases fulfill the clinical and radiological criteria for SARS-CoV-2 infection, some cases could be miss enrolled.
Serological cross-reactivity of SARS-CoV-2 immunoassays with DENV has been previously reported.(22,23) There is a high similarity between the SARS-CoV-2 – HR2 domain of the spike protein with envelope proteins from several flaviviruses, particularly DENV.(23) Flaviviruses are distributed around the world and include DENV, Zika virus, and West Nile virus, among others. Further factors such as polyclonal activation, which occurs in other diseases described here, may be associated with cross-reactivity in the immunological tests of COVID-19. The cross-reactivity of COVID-19 serological tests with a wide range of acute diseases can restrict the applicability of point-of-care tests in the screening of this infection in the population, including for its diagnosis or seroprevalence studies. Although, these findings need to be validated with a large number of samples and other viral infections, including the other cross-reactions reported in this study.
The authors call attention to the importance of these results for SARS-CoV-2 diagnosis in the endemic regions for DENV, such as Latin America, Asia, Australia, and Africa, in addition to endemic countries for other flavivirus diseases (North America and Europe).(24) This is mainly due to the overlap of some clinical signs and symptoms that may mask the accurate diagnosis of these diseases.
ROC curve is a valuable tool in assessing the performance of a diagnostic test over the range of possible values of a predictor variable. The area under a ROC curve provides a measure of discrimination and allows investigators to compare the performance of two or more diagnostic tests. In general, an AUC of 0.5 suggests no discrimination (i.e., ability to diagnose patients with and without the disease or condition based on the test), 0.7 to 0.8 is considered acceptable, 0.8 to 0.9 is deemed excellent, and more than that 0.9 is considered outstanding.(25) Comparing the results obtained with the three kits, none of them were adequate to discriminate the presence of infection in group 2, which corresponds to those classified as probable SARS-CoV-2 infection, with negative RT-PCR, but with clinical manifestation suggestive of COVID-19.
Cohen’s Kappa only assesses the correlation between the tests, without showing whether this correlation represents that both are diagnostically good or not.(9) Therefore, evaluating the other analyzed parameters (sensitivity, specificity, PPV and accuracy) it is possible to affirm that the Biolisa and Allserum kits presented a positive correlation in their results, with almost perfect Cohen’s Kappa values.
The limitation of this study is the small number of samples and the lack of blinding of the index test and reference standard. Among definite or probable SARS-CoV-2 samples, 46.97% were outpatients, of these, only two were asymptomatic. Therefore, it is unclear if the results could be expanded to asymptomatic or oligosymptomatic persons or even used on serological community surveys.
CONCLUSION
Our data demonstrate the good performance of the antibodies assays studied. We observed substantial heterogeneity in sensitivities of IgM and IgG antibodies between manufacturers. The high specificity of ELISAs may contribute to rapidly confirming the presence of SARS-CoV-2 infection and accelerate decision-making in emergency rooms and routing to appropriate hospital wards. Nonetheless, these ELISA tests cannot replace molecular diagnostics in acute-care settings, but should only be used as an additional screening tool when the improvement of hospital logistics is expected and their limitations are carefully considered. Furthermore, it is noteworthy that the kits available may have variable operational characteristics that can impact the results.
ACKNOWLEDGMENTS
The authors would like to thank all those involved in obtaining and preparing samples from the virology sector of Complexo Hospital de Clínicas. The authors also thank CAPES and CNPq.
REFERENCES
- Deeks JJ, Dinnes J, Takwoingi Y, Davenport C, Spijker R, Taylor-Phillips S, et al. Antibody tests for identification of current and past infection with SARS- CoV-2. Cochrane Database of Systematic Reviews, 2020; 6: Art. No.: CD013652. DOI: 10.1002/14651858.CD013652.
- World Health Organization. Public health surveillance for COVID-19. WHO/2019-nCoV/SurveillanceGuidance/2020.7. 2020; Last accessed, June 9, 2020.
- Food and Drug Administration. New York SARS-CoV-2 Real-time RT-PCR Diagnostic Panel. 2020; February 29. https://www.fda.gov/media/135662/download. Last accessed, March 9, 2020.
- Galen RS, Gambino SR. Beyond normality, the predictive value and efficiency of medical diagnoses. 1975; New York: Wiley & Sons; 237 p.
- Mitchell AJ. The clinical significance of subjective memory complaints in the diagnosis of mild cognitive impairment and dementia: a meta-analysis. Int J Geriatr Psych. 2008 Nov; 23(11):1191-202.
- Mitchell AJ. Sensitivity x PPV is a recognized test called the clinical utility index (CUI+). Eur J Epidemiol. 2011 Mar; 26 (3):251-2.
- McGee S. Simplifying likelihood ratios. J Gen Intern Med. 2002 Aug; 17(8):647-50.
- Akobeng AK. Understanding diagnostic tests 2: likelihood ratios, pre- and post-test probabilities and their use in clinical practice. Acta Pædiatr. 2007 Apr; 96(4):487-91.
- McHugh M L. Interrater reliability: the kappa statistic. Biochem Med (Zagreb). 2012; 22(3): 276–82.
- Vabret N, Britton GJ, Gruber C, Hegde S, Kim J, Kuksin M, et al. Immunology of COVID-19. Current State of the Sci. Immunity. 2020 Jun; 52(6): 910–41.
- Santos LAO, Campelo YDM, Beltrão RPL, Mendonça GS, Silva VA, Campelo VMB. Analysis of the effectiveness rate of rapid serological tests for COVID-19 registered in ANVISA, a systematic review in the literature. Res, Soc & Devel. 2021 Aug; 10(11)
- Whitman JD, Hiatt J, Mowery CT, Shy BR, Yu R, Yamamoto TN, et al. Test performance evaluation of SARS-CoV-2 serological assays. Preprint at medRxiv 2020; https://doi.org/10.1101/2020.04.25.20074856.
- Pellanda LC, Wendland EM, McBride AJA, Tovo-Rodrigues L, Ferreira MRA, Dellagostin OA, et al. Sensitivity and specificity of a rapid test for assessment of exposure to SARS-CoV-2 in a community-based setting in Brazil. Preprint at medRxiv. 2020; https://doi.org/10.1101/2020.05.06.20093476.
- Zhang ZL, Hou YL, Li DT, Li FZ. Diagnostic efficacy of anti-SARS-CoV-2 IgG/IgM test for COVID-19: A meta-analysis. J Med Vir. 2021; 93:366-374; https://doi.org/10.1002/jmv.26211.
- Zhao J, Yuan Q, Wang H, Liu W, Liao X, Su Y, et al. Antibody responses to SARSCoV- 2 in patients of novel coronavirus disease 2019. Clin Infect Dis. 2020; https://doi.org/10.1093/cid/ciaa344. pii: ciaa344.
- Xiang F, Wang X, He X, Peng Z, Yang B, Zhang J, et al. Antibody detection and dynamic characteristics in patients with COVID-19. Clin Infect Dis. 2020 Nov; 71(8):1930-1934. https://doi.org/10.1093/cid/ciaa461. pii: ciaa461.
- Guo L, Ren L, Yang S, Xiao M, Chang D, Yang F, et al. Profiling Early Humoral Response to Diagnose Novel Coronavirus Disease (COVID-19). Clin Infect Dis. 2020 Jul 28;71(15):778-785.doi:10.1093/cid/ciaa310. [Epub ahead of print].
- Cassaniti I, Novazzi F, Giardina F, Salivaro F, Sachs M, Perlini S, et al. Performance of VivaDiagTM COVID-19 IgM/IgG Rapid Test is inadequate for diagnosis of COVID-19 in acute patients referring to emergency room department. J Med Virol. 2020 March: 1-4. doi:10.1002/jmv.25800.
- Peeling RW, Wedderburn CJ, Garcia PJ, Boeras D, Fongwen N, Nkengasong J, et al. Serology testing in the COVID-19 pandemic response. Lancet Infect dis. 2020 Sept; 20: 245-9.
- D’Cruz RJ, Currier AW, Sampson VB. Laboratory Testing Methods for Novel Severe Acute Respiratory Syndrome-Coronavirus-2 (SARS-CoV-2). Front Cell Dev Biol. 2020 Jun; 8:468.
- Cota G, Freire ML, Souza CS, Pedras MJ, Saliba JW, Faria V, Alves LL, Rabello A, Avelar DM. Diagnostic performance of commercially available COVID-19 serology tests in Brazil. Int J Inf Diseases. 2020 Dec; 101: 382-390 https://doi.org/10.1016/j.ijid.2020.10.008.
- Faccini-Martínez ÁA, Rivero R, Garay E, García A, Mattar S, Botero Y, Galeano K, Miranda J, Martínez C, Guzmán C, Arrieta G, Contreras H, Kerguelen H, Moscote M, Brango E & Contreras V. Serological cross-reactivity using a SARS-CoV-2 ELISA test in acute Zika virus infection, Colombia. International Journal of Infectious Diseases. 2020 Jan; 101: 191-193. https://doi.org/10.1016/j.ijid.2020.09.1451.
- Lustig Y, Keler S, Kolodny R, Ben-Tal N, Atias-Varon D, Shlush E, Gerlic M, Munitz A, Doolman R, Asraf K, Shlush LI, & Vivante A. Potential antigenic cross-reactivity between severe acute respiratory syndrome coronavirus 2 (SARS-CoV-2) and dengue viruses. Clinical Infectious Diseases. 2020; 6: 1-11. https://doi.org/10.1093/cid/ciaa1207.
- Daep CA, Muñoz-Jordán JL, & Eugenin EA. Flaviviruses, an expanding threat in public health: focus on dengue, West Nile, and Japanese encephalitis virus. Journal of NeuroVirology. 2014; 20(6): 539-560. https://doi.org/10.1007/s13365-014-0285-z.
- Mandrekar JN. Receiver Operating Characteristic Curve in Diagnostic Test Assessment. J Thor Onc. 2010 Sep; 5(9): 1315-1316. https://doi.org/10.1097/JTO.0b013e3181ec173d.
Correspondência
Lucas Bochnia-Bueno
E-mail: [email protected]