Assessment of biomarkers with prognostic potential for Covid-19 in a high-complexity hospital
Avaliação de biomarcadores com potencial prognóstico para Covid-19 em um hospital de alta complexidade
Luis Rodrigues de Sena Neto1, Gislaine Custódio2, Alisson Fernandes dos Santos3
1 Hospital de Clínicas of Federal University of Paraná, Multiprofessional Residency Program in Urgency and Emergency – Clinical Analysis. Curitiba, PR, Brasil.
2 Hospital de Clínicas of Federal University of Paraná, Laboratory of Immunochemistry. Curitiba, PR, Brasil.
3 Hospital de Clínicas of Federal University of Paraná, Laboratory of Molecular Biology of Oncohematology Diseases. Curitiba, PR, Brasil.
Recebido em 10/02/2023
Aprovado em 23/02/2023
DOI: 10.21877/2448-3877.202300106
INTRODUCTION
The Covid-19 pandemic began with reported cases in Wuhan, China(1) and since then, the world has been working to understand the disease and find a cure or vaccine. The symptoms of Covid-19 typically include fever, cough, fatigue and body aches. Other symptoms may include difficulty breathing, sore throat, headache, loss of taste or smell, and nasal congestion. Some patients may experience mild symptoms or be asymptomatic, while others may become severely ill and require hospitalization. Those with underlying health conditions, such as heart and lung disease and diabetes, may become severely ill.(2)
Severe Covid-19 is an advanced stage of the disease, characterized by worsening symptoms and potential respiratory failure. It can lead to hospitalization and may sometimes be fatal, especially for those with underlying health issues. In severe cases of Covid-19, biomarkers may be useful in predicting outcomes in Covid-19 patients, including the risk of hospitalization, discharge, or death. Increased levels of inflammatory markers such as C – reactive protein (CRP), Interleukin 6 (IL-6) and ferritin (FERR) can indicate a severe immune response. High levels of D-dimer can signify a high likelihood of thrombosis. Studies have shown that lactate dehydrogenase (LDH), FERR, and D-dimer are associated with a higher risk of mortality in Covid-19 patients.(3-5) It’s crucial to acknowledge that the utilization of biomarkers in Covid-19 is still an evolving area and additional research is necessary to comprehend their usefulness in differentiating between mild from severe cases and for directing treatment.(3)
The Covid-19 pandemic worsened due to the rapid increase in both mild and severe cases worldwide. Delayed access to specialized care and the shortage of hospital beds negatively impacted patients and made Covid-19 a serious threat to public health. The overcrowding in hospitals during this pandemic highlighted the need for more efficient triaging methods in healthcare services.(6,7) In this context, the search for predictors of severity and prognostic biomarkers has become an important and necessary area of study.
The aim of this study was to retrospectively correlate biomarkers and clinical outcome of patients with Covid-19 admitted to Hospital de Clínicas of the Federal University of Paraná (CHC-UFPR/EBSERH), statistically compare these groups, and calculate a cut-off point for the parameters with the best performance that serve as a prognostic biomarker.
MATERIALS AND METHODS
A retrospective study was conducted on patients admitted to the Hospital de Clínicas of the Federal University of Paraná, Curitiba, Brazil. The study period was from July 2020 to June 2021, and all included patients had a RT-qPCR test result positive for SARS-CoV-2. The results of the biomarkers tests for LDH, CRP, FERR, Procalcitonin (PCT), Aspartate aminotransferase (AST) and Creatinine (Cr) were obtained from the hospital’s electronic records system. All biomarkers were measured using the Abbott Alinity C/I system at the hospital’s immunochemistry laboratory. Patients aged 12 years and younger and those with missing results for all biomarkers of interest were excluded from this study.
The patients were divided in two groups based on their outcomes: discharge or death. Statistical analyses were performed using SPSS and Jamovi software. Firstly, the distribution of the variables was analyzed using the Kolmogorov-Smirnov test and then the groups were compared using the Mann-Whitney test for each biomarker. Based on the results, a Receiver Operator Characteristic (ROC) curve was generated for those with a significant p-value (p<0.05) and the best cut-off point for sensitivity and specificity was selected. Once the cut-off was determined, it was used to classify the patients into not high-risk (discharge) or high-risk (death) groups and to calculate the positive and negative predictive values and the accuracy as a strategy for laboratorial performance evaluation.
ETHICS
This study was approved by the Hospital Ethic Committee under the CAEE number of 51396421.5.0000.0096 and adhered to the principles of the Declaration of Helsinki. Patients’ privacy was preserved and the information was only used for the purposes of this study.
RESULTS
A total of 356 patients were included in this study, with 213 being discharged and 143 patients dying. The largest group was elderly patients aged 60 years and older, followed by the adults aged between 20 and 59 years. The youth aged between 13 and 19 years was represented by only 3 patients. 160 patients were women and 196 were men. The group with the highest number of discharges was adults (122), while the highest number of deaths occurred in the elderly group (106).
The results of the Kolmogorov-Smirnov test indicated a non-normal distribution of the variables. The Mann-Whitney test results revealed that there was a statistically significant difference between the groups for LDH, CRP, PCT and Cr (p<0.001), while no significant difference was found between the groups for FERR (p=0.135) and AST (p=0.466). The full data is presented in Table 2.
An ROC curve analysis was performed to determine the optimal cut-off values for LDH, CRP, PCT and Cr. The analysis revealed that only PCT (AUC 0.750; p<0.001; SE 0.043; CI95% 0.666 – 0.834) had an area under the curve (AUC) value greater than 0.7. As a result, the study continued with further analysis of PCT only. The cut-off value of 0.21ng/mL for PCT was established based on the results of ROC curve analysis.
The cut-off was utilized to categorize 199 patients into high or low risk of death. The sensitivity was found to be 82.57%, the specificity was 60%, the positive and negative predictive values were 71.43% and 73.97% respectively. The accuracy was calculated as 72.36%. As shown in Table 4, when the cut-off was applied, the patients in the low-risk group for death or potential discharge were correctly classified 74% of the time, and patients in the high-risk group for death were correctly classified 71.4% of the time.
Table 1
Characteristics of the study population.
| Population | Total
N (%) |
Discharge
N (%) |
Death
N (%) |
| N | 356 | 213 (59.83) | 143 (40.17) |
| Youth (13 – 19 years) | 3 (0.9) | 2 (66.67) | 1 (33.33) |
| Adults (20 – 59 years) | 158 (44.3) | 122 (77.22) | 36 (22.78) |
| Eldery (≥60 years) | 195 (54.8) | 89 (45.64) | 106 (54.36) |
| Women | 160 (45) | 94 (58.75) | 66 (41.25) |
| Men | 196 (55) | 119 (60.71) | 77 (39.29) |
Source: The authors.
Table 2
Statistical analysis of the biomarkers.
| Variable | Reference
range |
Median
discharge (25; 75) |
Median
death (25; 75) |
M-W U
(p) |
| LDH
(U/L) |
125 – 202 | 383
(261; 503) |
466
(314; 623) |
<0.001 |
| CPR
(mg/dL) |
< 0.5 | 5.73
(2.2; 11.9) |
9.195
(4.6; 15.6) |
<0.001 |
| FERR
(ng/mL) |
21.81 – 274.66 | 1175.36
(549.1; 2184.9) |
1380.16
(675.5; 2682.8) |
0.135 |
| PCT
(ng/mL) |
< 0.5 | 0.140
(0.06; 0.5) |
0.690
(0.2; 3) |
<0.001 |
| AST
(U/L) |
5 – 34 | 36
(24.5; 62) |
41.5
(29.7; 54) |
0.466 |
| Cr
(mg/dL) |
0.72 – 1.25 | 0.85
(0.7; 1.1) |
1.29
(0.8; 1.9) |
<0.001 |
Source: The authors.
Abbreviations: M-W – Mann-Whitney U test; LDH – lactate dehydrogenase; CPR – C-reactive protein; FERR – ferritin; PCT – procalcitonin; AST – aspartate aminotransferase; Cr – creatinine.
Table 3
ROC curve analysis.
| Variable | AUC | p* | Interval of confidence of 95% | |
| Lower limit | Upper limit | |||
| LDH | 0.595 | 0.059 | 0.498 | 0.693 |
| CPR | 0.493 | 0.883 | 0.393 | 0.592 |
| PCT | 0.750 | <0.001 | 0.666 | 0.834 |
| Cr | 0.657 | 0.002 | 0.562 | 0.751 |
Abbreviations: AUC – area under curve; LDH – lactate dehydrogenase; CPR – C-reactive protein; PCT – procalcitonin; Cr – creatinine. Source: The authors. *Null hypothesis: true area = 0.5.
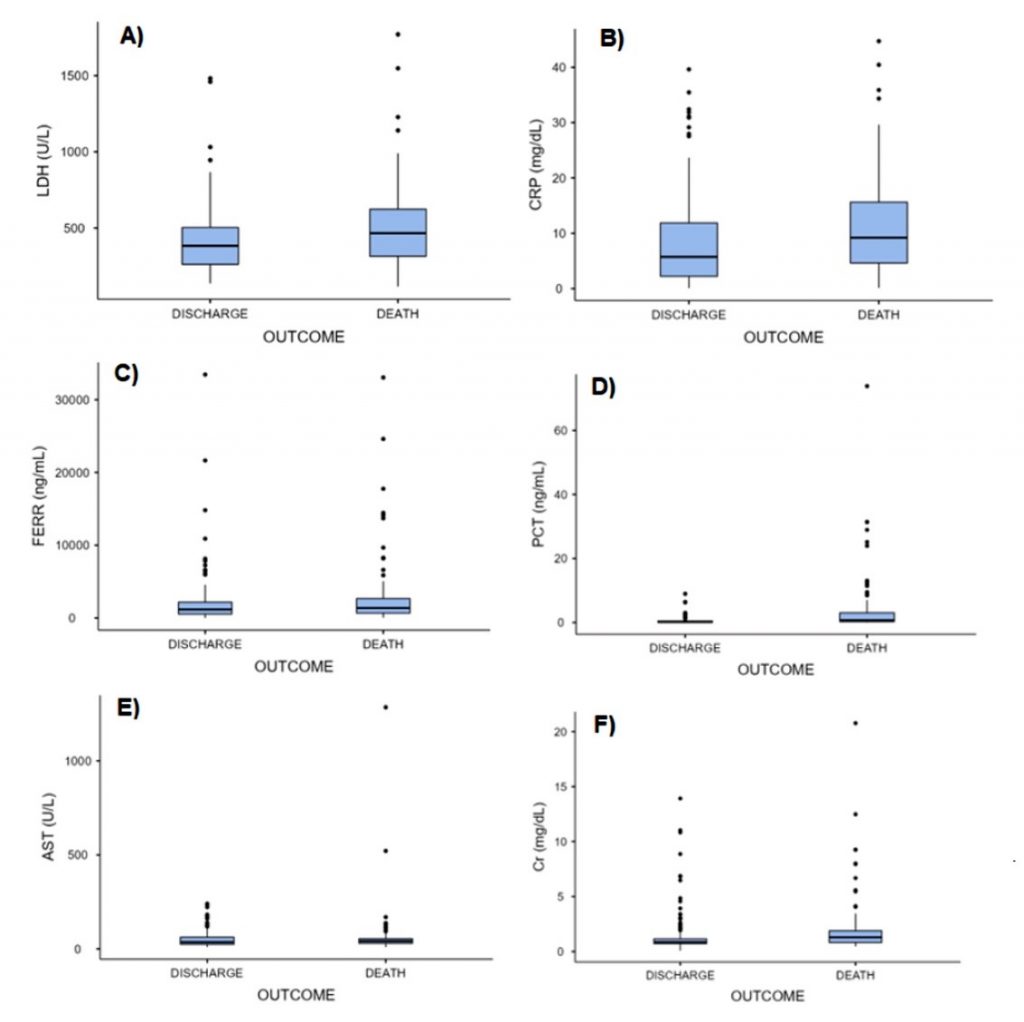
Figure 1
Biomarkers distribution
Source: The authors.
Abbreviations: A) LDH – lactate dehydrogenase; B) CPR – C-reactive protein; C) FERR – ferritin; D) PCT – procalcitonin; E) AST – aspartate aminotransferase; F) Cr – creatinine.
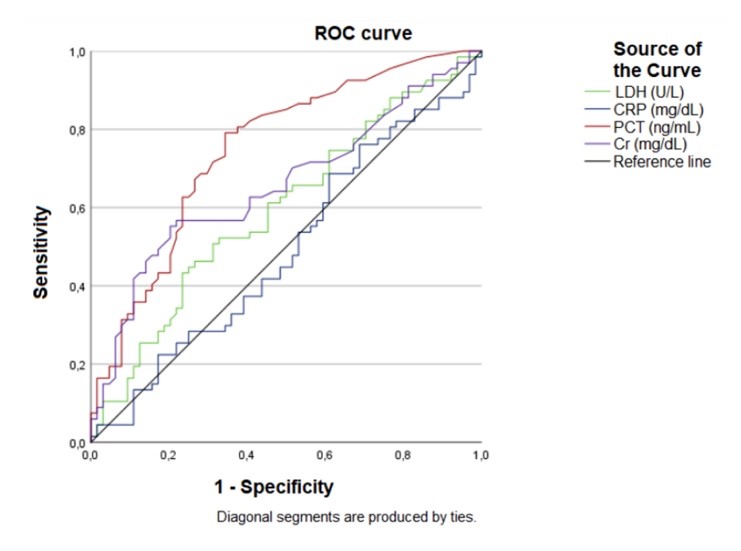
Figure 2
ROC curve.
Source: The authors.
Abbreviations: LDH – lactate dehydrogenase; CPR – C-reactive protein; PCT – procalcitonin; Cr – creatinine.
Table 4
Evaluation of the Laboratory Performance of Procalcitonin as a Severity Biomarker in Covid-19.
| Cut-off
0.21 ng/mL |
Discharge
N (%) |
Death
N (%) |
Total
N (%) |
| Under cut-off | 54 (74) | 19 (26) | 73 (36.7) |
| Equal or above cut-off | 36 (28.6) | 90 (71.4) | 126 (63.3) |
| Total | 90 (45.2) | 109 (54.8) | 199 |
Source: The authors.
DISCUSSION
In this study, the majority of patients were elderly, which may be attributed to a higher prevalence of preexisting medical conditions in this age group. Elderly individuals are known to be more susceptible to severe Covid-19 and life-threatening symptoms.(8) The literature suggests that younger age groups are less susceptible to severe Covid-19,(9) as evidenced by the limited representation of the youth group (only 3 patients) in this study. Additionally, there was a higher number of male patients compared to female.
The statistical analysis of this study indicated a significant difference between the discharge and the death groups in terms of serum biomarker concentrations of LDH, CRP, PCT, and Cr, with higher values observed in the death group. This correlation between elevated levels of these biomarkers and the severity of SARS-CoV-2 illness has been previously reported in the literature.(4,5,10) Although the levels of FERR and AST were elevated in both groups, the statistical analysis did not reveal a significant difference between the groups. Nevertheless, previous studies have established a correlation between FERR and AST levels and acute Covid-19.(5,11,12)
A biomarker that is both sensitive and specific would have a great value in screening hospitalized patients to predict the risk of serious outcomes. The ROC curve is a useful tool for evaluating the predictive ability of a biomarker, with an AUC of at least 0.7 considered to indicate a good predictor model.(13) In this study, only PCT (AUC 0.750) had an AUC value above the minimum threshold. There is evidence in the medical literature of a correlation between PCT levels and severe cases and poor outcomes of Covid-19.(5,10,14) Our results suggest that PCT may be considered a potential biomarker for predicting death and for use in hospital triage to determine the severity of Covid-19.
The performance of PCT as a death predictor biomarker was evaluated in the laboratory and showed high sensitivity and high positive and negative predictive values. Although the specificity was lower than the sensitivity, it can still be useful in a life-threatening context as a higher rate of false negatives reduces the risk of missing true positive cases. PCT had good accuracy in classifying patients as either discharged or deceased, although it is not specific to Covid-19.
LIMITATIONS
The study has several limitations, including being a single-center retrospective design with a small sample size, which may restrict the generalizability of the results. It was not possible to compare patients with mild and severe Covid-19 due to the hospital only treating severe cases. The outcomes may have been influenced by competing risks, including death from comorbidities, which were not evaluated in this study. There was a lack of standardization in Covid-19 testing within the hospital, and the clinician was responsible for determining which parameters to evaluate to each patient, resulting in some patients having results for some biomarkers but not others. Additionally, procalcitonin is not a specific biomarker for Covid-19 and its elevation may be seen in other conditions besides Covid-19.
CONCLUSION
This study observed elevated levels of LDH, CPR, PCT and Cr in patients who died. Procalcitonin showed the best laboratorial performance as a biomarker of severity and a cut-off value of 0.21 ng/mL were determined with high sensitivity and specificity. To validate these findings and establish the usefulness of procalcitonin as a prognostic tool for Covid-19, further studies with larger samples sizes and multiple center designs are necessary.
REFERENCES
- Guan WJ, et al. Clinical Characteristics of Coronavirus Disease 2019 in China. New England Journal of Medicine 2020; 382(18):1708-1720. https://doi.org/10.1056/nejmoa2002032
- Zhang JJ, et al. Clinical characteristics of 140 patients infected with SARS-CoV-2 in Wuhan, China. Allergy 2020; 75(7):1730-1741. https://doi.org/10.1111/all.14238
- Bodaghi A, Fatahi N, Ramazani A. Biomarkers: promising and valuable tools towards diagnosis, prognosis and treatment of Covid-19 and other diseases. Heliyon 2023; 2023(1):e13323. https://doi.org/10.1016/j.heliyon.2023.e13323
- Keddie S, Ziff O, Chou MKL, Taylor RL, Heslegrave A, Garr E, Lakdawala N, Church A, Ludwig D, Manson J. Laboratory biomarkers associated with Covid-19 severity and management. Clinical Immunology 2020; 221:108614. https://doi.org/10.1016/j.clim.2020.108614
- Velavan TP, Meyer CG. Mild versus severe Covid-19: laboratory markers. International Journal of Infectious Diseases 2020; 95:304-307. https://doi.org/10.1016/j.ijid.2020.04.061
- Plagg B, et al. Primary health care and hospital management during Covid-19: lessons from Lombardy. Risk Management and Healthcare Policy. 2021 Sep;14:3987-92. http://dx.doi.org/10.2147/rmhp.s315880
- Sandhu P, et al. Emergency department and intensive care unit overcrowding and ventilator shortages in US hospitals during the Covid-19 pandemic, 2020-2021. Public Health Reports. 2022 Jun 1;137(4):796-802. http://dx.doi.org/10.1177/00333549221091781
- Grasselli G, et al. Baseline characteristics and outcomes of 1591 patients infected with SARS-CoV-2 admitted to ICUs of the Lombardy region, Italy. JAMA. 2020 Apr 28;323(16):1574. http://dx.doi.org/10.1001/jama.2020.5394
- Waghmare A, Hijano DR. SARS-CoV-2 infection and Covid-19 in children. Clinics in Chest Medicine. 2022 Nov;43(4):1-41. http://dx.doi.org/10.1016/j.ccm.2022.11.014
- Mahat RK, et al. The dynamics of inflammatory markers in coronavirus disease-2019 (Covid-19) patients: a systematic review and meta-analysis. Clinical Epidemiology and Global Health. 2021 Jul;11:100727. http://dx.doi.org/10.1016/j.cegh.2021.100727
- Lino K, et al. Serum ferritin at admission in hospitalized Covid-19 patients as a predictor of mortality. The Brazilian Journal of Infectious Diseases. 2021 Mar;25(2):101569. http://dx.doi.org/10.1016/j.bjid.2021.101569
- Kaushal K, et al. Serum ferritin as a predictive biomarker in Covid-19: a systematic review, meta-analysis, and meta-regression analysis. Journal of Critical Care. 2022 Feb;67:172-81. http://dx.doi.org/10.1016/j.jcrc.2021.09.023
- Verbakel JY, et al. ROC curves for clinical prediction models part 1. Journal of Clinical Epidemiology. 2020 Oct;126:207-16. http://dx.doi.org/10.1016/j.jclinepi.2020.01.028
- Hoodbhoy Z, Jafri L, Ahmed S. Prognostic value of serum procalcitonin in Covid-19 patients: a systematic review. Indian Journal of Critical Care Medicine. 2021 Jan 18;25(1):77-84. http://dx.doi.org/10.5005/jp-journals-10071-23706
Correspondência
Gislaine Custódio
E-mail: [email protected]