Clinical and laboratory profile of patients with cerebrospinal fluid hypercellularity: A retrospective study in a Brazilian University Hospital
Perfil clínico e laboratorial de pacientes com hipercelularidade no líquido cefalorraquidiano: um estudo retrospectivo em um hospital universitário brasileiro
Cecília de Farias Dutra1, Laura Bonai Casal1,2, João Batista Costa-Neto1,2,3, Fernanda Gomes Nascimento1,2,4, José Antônio Mainardi de Carvalho1,2, Clóvis Paniz1,2
1 Universidade Federal de Santa Maria, Laboratório de Pesquisa em Análises Clínicas Aplicadas – LAPACA, Departamento de Análises Clínicas e Toxicológicas. Santa Maria, RS, Brazil.
2 Universidade Federal de Santa Maria, Programa de Pós-Graduação em Ciências Farmacêuticas, Departamento de Análises Clínicas e Toxicológicas. Santa Maria, RS, Brazil.
3 Academia do Líquor, Análise de líquor – São Bernardo do Campo, SP – Brazil.
4 Universidade Federal de Santa Maria, Hospital Universitário de Santa Maria. Santa Maria, RS, Brazil.
Received on 12/11/2024
Approved on 05/03/2024
DOI: 10.21877/2448-3877.202500213.en
INTRODUCTION
Cerebrospinal fluid (CSF) is a complex biological fluid primarily produced by the choroid plexuses, which are secretory tissues located in specific ventricles and, to a lesser extent, in the interstitial and subarachnoid spaces.(1) This fluid circulates between the cerebral ventricles and the subarachnoid space, located between the arachnoid leptomeninges and the pia mater in the brain and spinal cord, playing an essential role in mechanical protection. It functions as a shock absorber for the brain and spinal cord, protecting them from external shocks, traumas, and pressure. Furthermore, it is fundamental in maintaining brain buoyancy, defending the central nervous system (CNS) against infectious agents, removing waste and toxic substances, and circulating nutrients.(2,3)
CSF analysis is a cornerstone in diagnosing neurological disorders, where hypercellularity—defined as an abnormal increase in nucleated cells—serves as a key diagnostic marker.(4–6) Under physiological conditions, CSF cellularity is remarkably low, with reference values typically ranging <5 cells/μL in adults and <20 cells/μL in neonates.(7-9) This strict threshold reflects the blood-brain barrier’s (BBB) restrictive role, which permits only limited immune surveillance (e.g., activated T cells) but prevents widespread immune cell infiltration.(7,10)
However, neuroinflammatory processes disrupt this equilibrium. Infections (bacterial, viral, fungal, or parasitic), autoimmune diseases, trauma, or neoplasms can trigger immune cell migration into the CSF via postcapillary venules, the choroid plexus, or the arachnoid barrier.(6,11,12) Despite the diagnostic utility of hypercellularity, critical gaps persist, like: 1. Disease-specific patterns: While elevated cell counts signal pathology, the differential composition of immune cells (e.g., neutrophils in bacterial meningitis vs. lymphocytes in viral infections) and their correlation with etiologies remain inadequately characterized;(4,13-15) 2. Prognostic value: The relationship between cellularity levels, subtypes of infiltrating cells, and clinical outcomes (e.g., treatment response, mortality) is poorly understood, particularly in resource-limited settings;(16-18) 3. Regional disparities: Most studies defining CSF norms and inflammatory profiles derive from high-income countries, limiting their generalizability to populations with distinct epidemiological burdens (e.g., higher rates of neuroinfections in tropical regions).(19,20)
In southern Brazil, where infectious and inflammatory CNS diseases are prevalent, a detailed understanding of CSF hypercellularity patterns could optimize diagnostic workflows and prognostic assessments. To address these gaps, this study aimed to establish a clinical-laboratory profile of patients with CSF hypercellularity treated at a university hospital in southern Brazil from January 2020 to December 2023.
MATERIALS AND METHODS
The dataset comprised medical records and laboratory test results from all patients who underwent CSF examinations at the University Hospital of Santa Maria in Rio Grande do Sul (southern Brazil) between January 1, 2020, and December 31, 2023. The inclusion criteria were as follows: age of at least one year, presence of more than 5 cells/mm³ in CSF (indicative of increased cell count)(7,8,9), and a properly completed medical record, along with laboratory data including at least cellularity, glycorrhachia, and protein levels.
During this period, 3,250 samples were analyzed at the hospital. Patients under one year of age (n=798) were excluded due to the blood-brain barrier still being formed, which could result in a different response profile to the assessed disorders. Additionally, patients who presented less than five cells in CSF cytology were excluded from the analysis (n=1,790), as we aimed to evaluate patients with increased cell levels. Patients with incomplete data in the hospital’s medical records and laboratory examination system were also excluded (n= 87). Of the remaining 575 samples analyzed, 251 were excluded due to being multiple samples from the same patients who underwent multiple analyses throughout the study period. In cases where a patient had undergone multiple lumbar punctures at different times, the results from the collection with the highest number of cells in the CSF cytology were included. Thus, after these excluded data, this study involved the participation of 325 patients.
Clinical data collected included the subject’s sex, age, serology, diagnoses obtained, and deaths. Laboratory data included cytological examination of the CSF, glucose and protein levels measurements, and tests designed to identify etiological agents. The glucose and protein levels were quantified by enzymatic and immunoturbidimetric methods, respectively, using the Dimension RxL analyzer (Siemens Healthcare Diagnostics Inc., USA). The total cell count was obtained using a Fuchs-Rosenthal chamber. A differential cell count was performed by optical microscopy in a slide prepared using an Excelsa 3400 cytocentrifuge (Fanem, Brazil), followed by staining with MayGrünwald-Giemsa. The laboratory where the data were collected participates in both internal and external quality assurance programs under the National Quality Control Program (PNCQ). The study was conducted in accordance with the Declaration of Helsinki. This study was approved by the institution’s Research Ethics Committee (CAAE no. 23081.034325/2022-52).
STATISTICAL ANALYSIS
The statistical analyses were conducted using SPSS version 22.0 (IBM, USA) and GraphPad Prism version 5.04 (GraphPad, USA) software. The Kolmogorov-Smirnov normality test was employed to test the distribution of the variables. Given that the data did not exhibit a normal distribution, we expressed them as medians and interquartile ranges. Comparisons between groups were performed using the Kruskal-Wallis test and Dunn’s multiple comparison test when significant. The count of individuals and percentages represented categorical variables, and the chi-square test was applied for comparative analysis. A significant threshold of 5% (p<0.05) was adopted.
RESULTS
Upon samples examination of the 325 patients, we observed that most (48.3%) presented with CNS infections. The second most prevalent cause of elevated cell counts was neoplasms, accounting for 16% of cases. A comprehensive overview of all conditions that result in increased cellularity within the CNS is presented in Table 1.
Table 1
Etiology of hypercellularity in cerebrospinal fluid according to diagnostic category in 325 samples analyzed in a University Hospital
| Diagnostic category | Confirmed
n = 240 |
Confirmed + presumed*
n = 325 |
|
| General infections | 72 (30.0) | 157 (48.3) | |
| Bacterial infections | 36 (50.0) | 67 (42.7) | |
| Viral infections | 9 (12.5) | 40 (25.5) | |
| Fungal infections | 16 (22.2) | 18 (11.5) | |
| Parasitic infections | 7 (9.7) | 7 (4.5) | |
| Concomitant bacterial and fungal infections | 3 (4.2) | 3 (1.9) | |
| Concomitant fungal and parasitic infection | 1 (1.4) | 1 (0.6) | |
| Undefined etiology | 21 (13.4) | ||
| Autoimmune | 15 (6.2) | 15 (4.6) | |
| Neoplasms | 52 (21.6) | 52 (16.0) | |
| Stroke/Trauma | 36 (15.0) | 36 (11.1) | |
| Epilepsy | 23 (9.6) | 23 (7.1) | |
| Others | 42 (17.5) | 42 (12.9) | |
The results are expressed as some individuals (percentage). *Presumed: when a diagnosis was established without laboratory confirmation, typically through clinical manifestation or image diagnostic (magnetic resonance imaging or computed tomography).
Most of the 325 patients included in the study were male, with a median age of 37. Among the patients, 63 (19.4%) were living with human immunodeficiency virus (HIV), and 77 (23.7%) died. The characteristics of all study patients, stratified by the different groups of diagnosed diseases, are presented in Table 2.
Additionally, we found significant discrepancies between the stratified groups when comparing cellularity, CSF protein, and glycorrhachia (i.e., CSF glucose levels. Cellularity in neuroinfection [49 (8–304) cells/mm³] was significantly higher than that observed in the epilepsy group [10 (5–23) cells/mm³] and the autoimmune group [8 (6–14) cells/mm³] (p= 0.002). In epilepsy, CSF protein levels were lower [31.2 (22.2–72.9) mg/dL] than those observed in the neuroinfection group [81.8 (45.8–172.0) mg/dL] (p=0.004). The highest glycorrhachia values were found in the stroke/trauma group [73.0 (61.0–91.7) mg/dL], being significantly higher than those in the neuroinfection [53.5 (38.7–71.0) mg/dL] and neoplasia [54.0 (48.0–76.0) mg/dL] groups (p<0.001). Detailed data on cellularity, CSF protein, and glycorrhachia across CNS disease groups are presented in Table 3.
Table 2
Profile of patients who underwent lumbar puncture between 2020 and 2023 with more than 5 cells/mm³ in the cerebrospinal fluid, treated at a University Hospital
| Variables | Total
n = 325 |
Infection
n = 157 |
Autoimmune
n = 15 |
Neoplasms
n = 52 |
Epilepsy
n = 23 |
Stroke or trauma
n = 36 |
Others
n = 42 |
p |
| Age (Y) | 37 (12–56) | 37 (10–52)a | 36 (10–55)a,b,c | 41 (10–59)a,c | 8 (5–25)b | 52 (37–62)c | 40 (23–57)a,c | < 0.001 |
| Sex (Female) | 132 (40.6) | 62 (39.5) | 8 (53.3) | 19 (36.5) | 13 (56.5) | 8 (22.2) | 22 (52.4) | 0.046 |
| HIV | 63 (19.4) | 38 (24.2)a | 0 (0.0) | 6 (11.5) a,b | 5 (21.7) a,b | 1 (2.8)b | 13 (31.0)a | 0.003 |
| Outcome (death) | 77 (23.7) | 37 (23.6)a | 1 (6.7)a | 24 (46.2)b | 2 (8.7)a | 7 (19.4)a | 6 (14.3)a | 0.001 |
Continuous variables are presented as median with interquartile ranges. The Kruskal-Wallis test was employed to compare the groups. Dunn’s multiple comparison test was performed when a statistically significant difference was identified. Categorical variables are expressed as the number of individuals (percentage) and values from different groups were compared using the Chi-square test.
Table 3
Cerebrospinal fluid cellularity, protein, and glycorrhachia in different groups of diseases of the central nervous system from patients who underwent lumbar puncture between 2020 and 2023 with more than 5 cells/mm³ in the cerebrospinal fluid, treated at a University Hospital
| Variables | Infection | Autoimmune | Neoplasms | Epilepsy | Stroke or trauma | p |
| Cells (/mm³) | 49 (8–304)a
n = 157 |
8 (6–14)b,c
n = 15 |
14 (6–64)a,c,d
n = 52 |
10 (5–23)b,d
n = 23 |
15 (7–47)a,c,d
n = 36 |
0.002 |
| Protein (mg/dL) | 81.8 (45.8–172.0)a
n = 154 |
67.5 (49.0–492.1)a,c
n = 14 |
52.9 (34.5–106.8)a,d
n = 44 |
31.2 (22.2–72.9)b,c,d
n = 23 |
78.2 (52.2–127.4)a,c
n = 35 |
0.004 |
| Glycorrhachia (mg/dL) | 53.5 (38.7–71.0)a
n = 154 |
67.0 (60.0–74.5)a,c
n = 14 |
54.0 (48.0–76.0)a
n = 42 |
62.0 (47.0–79.0)a,d
n = 23 |
73.0 (61.0–91.7)b,c,d
n = 36 |
<0.001 |
Different superscript letters between columns indicate differences between groups. The Kruskal-Wallis test was employed to compare the groups. Dunn’s multiple comparison test was performed when a statistically significant difference was identified.
We found significant differences between glycorrhachia and CSF protein levels regarding the leading agents causing neurological infections. Notably, bacterial [52 (28-68) mg/dL] and fungal infections [31 (20-51) mg/dL] exhibited significantly lower glucose levels compared to viral infections [60 (33-72) mg/dL] (p<0.001), while bacterial infections demonstrated markedly elevated protein concentrations [109 (56-251) mg/dL] compared with viral ones [65 (37-110) mg/dL (p=0.027). Cellularity was most pronounced in bacterial infections, with neutrophilic predominance, whereas viral, fungal, and parasitic infections showed lymphocytic predominance. Figure 1 illustrates the triad of (A) neutrophilic-predominant cellularity in bacterial infections, (B) severe hypoglycorrhachia in bacterial/fungal cases, (C) disproportionate proteinorachia elevation in bacterial etiologies and (D) cellular predominance in each neuroinfection group.
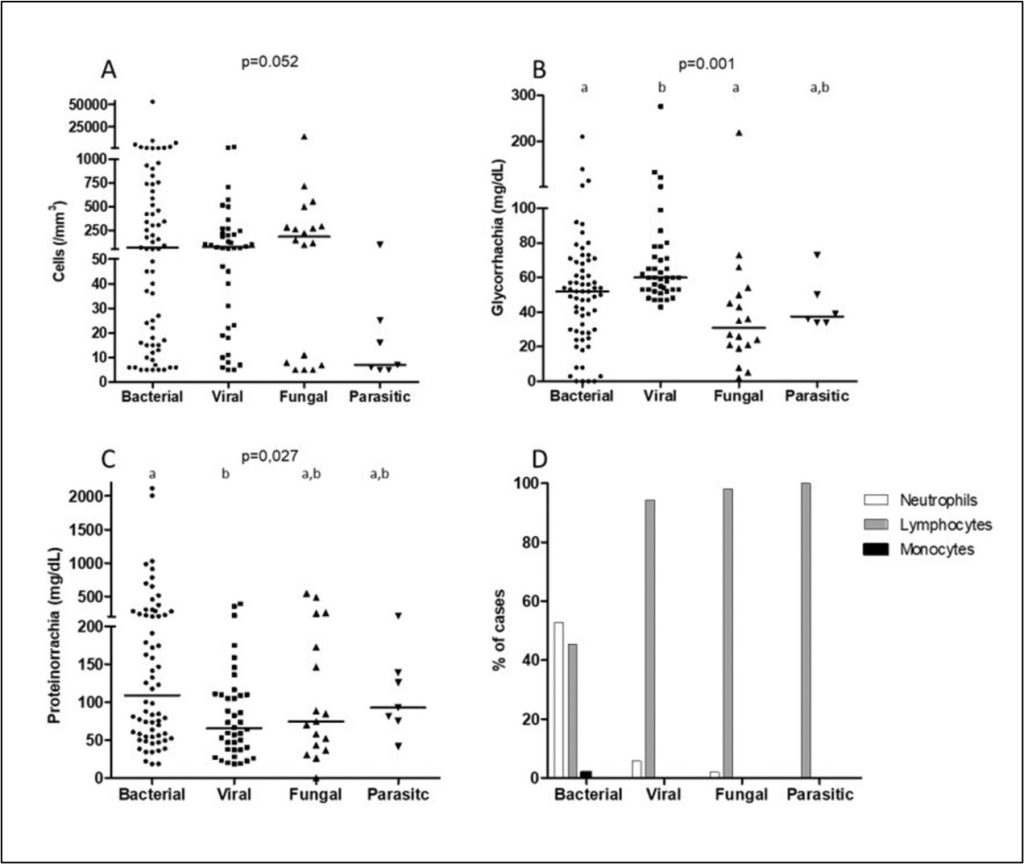
Figure 1
Cerebrospinal fluid cellularity (A), glycorrhachia (B), proteinorrachia (C), and cellular predominance (D) in the different groups of infection etiologies from 157 patients with meningitis who underwent lumbar puncture between 2020 and 2023 with more than 5 cells/mm³ in the cerebrospinal fluid, treated at a University Hospital
Different letters at the top of the group data indicate differences between them. The Kruskal-Wallis test was employed to compare the groups. Dunn’s multiple comparison test was performed when a statistically significant difference was identified.
DISCUSSION
This study conducted a retrospective analysis of data from patients with CSF hypercellularity treated at a university hospital to outline profiles for different diseases and identify changes in laboratory parameters. Hypercellularity in the CSF is an essential marker for inflammatory or infectious processes in the CNS and indicates the probable diagnosis of several diseases.(15)
The primary conditions associated with increased cellularity in CSF were neuroinfections, followed by neoplastic diseases and conditions related to stroke or trauma. These findings differ from a study conducted in Denmark, in which there was a predominance of neurological infections followed by vascular causes, degenerative diseases, and neoplasms.(11) The lack of data on patients with less than 5 cells/mm³ in CSF may have excluded many cases of neurodegenerative diseases, which do not always present CSF hypercellularity.
Among all disease group, neuroinfections, including meningitis and encephalitis, exhibited a higher median cellularity compared to other disease groups. The high cellularity observed in bacterial infections indicates acute inflammation.(14) Additionally, both neuroinfections and neoplastic diseases displayed reduced CSF glucose concentrations. The high demand for glucose by pathogenic microorganisms and cancer cells, as evidenced in several other studies, aligns with our results.(12,17,18)
The significant differences in glycorrhachia (bacterial/fungal vs. viral) and CSF protein levels (bacterial > other etiologies) among etiological agents underscore distinct pathophysiological mechanisms: bacterial infections drive intense glycolysis and blood-brain barrier disruption, while viral infections elicit milder metabolic shifts.(21,22) These patterns, combined with neutrophilic (bacterial) vs. lymphocytic (viral/fungal) predominance, provide diagnostic leverage in resource-limited settings where pathogen confirmation is delayed (Table 3, Figure 1).
Furthermore, neuroinfections had bacteria as their main etiological agents, followed by viruses and fungi. A comparison of the characteristics of infections caused by the different classes revealed that bacterial and fungal infections exhibited lower median concentrations of glycorrhachia compared to viral infections. Moreover, bacterial infections had higher protein concentrations. These findings can be attributed to the inherent properties of microbial structure and metabolism, which influence varying levels of glucose consumption and the immune response to bacteria, resulting in increased proteinorachia.(19,20)
Cytologically, most bacterial infections showed neutrophilic predominance, while the remaining infections showed lymphocytic predominance. These data illustrate the well-established phenomenon of the immune response, which favors neutrophilia in bacterial infections and lymphocytosis in viral, fungal, and parasitic infections.(10) This cytological behavior may be associated with the specific location of the infection, such as meningitis, meningoencephalitis, encephalitis, or myelitis.(23) However, it is noteworthy that many bacterial infections of the CNS have lymphocyte predominance. Therefore, the clinician must be aware of this finding to avoid delays in treating bacterial meningitis, which can often prove fatal. In contrast, Jaijakul and peers(15) presented an alternative perspective on this overlap. In a multicenter study conducted in the United States, which included 182 patients with confirmed viral neurological infections, 25% exhibited the CSF’s neutrophilic dominance. The study concluded that this overlap is more prevalent during the initial days of infection. The presumption regarding etiological agents in most cases arises from several limitations present in the health system, including the low sensitivity of the Gram method and the time required for microbial cultures to grow. Furthermore, leukocyte predominance and non-laboratory practices such as neuroimaging exams allow for this presumption and a faster initiation of treatment.(13)
The variability in cellular patterns underscores the complexity of diagnosing CNS infections. Beyond laboratory findings, patient-specific factors such as immune status play a pivotal role. In this context, our findings also revealed that 19.4% of the patients were living with HIV, a prevalence consistent with the observations of Chen et al.(16), who reported that HIV-associated immunosuppression increases susceptibility to opportunistic CNS infections. This aligns with earlier evidence from Onkarappa et al. (2020),(24) whose retrospective study on HIV/AIDS-associated neuroinfections in India underscored the heightened risk of CNS complications in this population. Notably, their work identified opportunistic infections as the most frequent neurological manifestation in AIDS patients and a major contributor to mortality.
In our cohort, mortality among HIV-positive patients reached 23.7%, further emphasizing the severe clinical trajectory of HIV-related neurological disease. This elevated fatality rate reinforces the critical need for early detection and targeted management of CNS infections in immunocompromised individuals, particularly in high-prevalence settings.
In comparison with studies conducted in Latin America, our data present relevant similarities and contrasts. For example, a Colombian study observed a significant prevalence of bacterial meningitis, especially invasive meningococcal disease caused by Neisseria meningitidis.(25) In contrast to both studies, Silva et al., in an analysis of the epidemiological dynamics of meningitis in Brazil, observed a stationary trend in the prevalence of viral meningitis and a decreasing trend in bacterial meningitis and other etiological agents. These data reinforce the importance of considering the regional context and the characteristics of the population served when interpreting laboratory and clinical findings of CSF.(26)
These regional disparities highlight the need for localized diagnostic protocols. In line with this, other studies conducted in Brazil corroborate the laboratory findings observed in this analysis, especially with regard to elevated cellularity and protein levels in bacterial infections of the CNS. A study conducted in a hospital in the metropolitan region of Porto Alegre/RS reported that, in bacterial meningitis, hypoglycorrhachia, CSF hyperprotein levels and significant elevation of cellularity were observed, reinforcing the usefulness of the combined analysis of CSF parameters as an effective diagnostic tool in differentiating between infectious etiologies.(27)The observed patterns of hypercellularity and increasing in CSF protein align with prior retrospective research reported in Mexican children, as described by Franco-Paredes et al. (2008)(28).
The study’s limitations must be acknowledged, such as the presumption of diagnoses based on clinical characteristics and cellular predominance without confirmation of the etiological agent. Additionally, as this was a retrospective study, only data from previously performed routine examinations were available, precluding the inclusion of new tests. Despite these limitations, the data collected by the study provides valuable insight and shows a profile of CSF analyses with high cellularity.
CONCLUSION
The results demonstrate that microbial infections are the most prevalent CNS disorders in the studied population. The primary etiological agents are bacteria, followed by viruses and fungi. The highest cell counts were observed in cases of neuroinfection, while infections caused by bacterial and fungal agents exhibited a more pronounced reduction in glycorrhachia compared to other infections.
The study also underscores the relatively low cellularity in most etiologies, particularly non-bacterial ones. This highlights the importance of technical precision in the laboratory preparation of CSF and the establishment of clear reference values for identifying hypercellularity. This allows physicians to make the most precise clinical decisions.
In summary, this study delineates the profile of patients undergoing CSF analysis in the region under study, which encompasses the areas served by a highly complex hospital in the central region of Rio Grande do Sul State in southern Brazil. Additional research, including multicenter analyses and complementary molecular methods, is needed to validate these findings and improve risk stratification in neuroinfections, particularly in underrepresented populations.
ACKNOWLEDGMENTS
The authors kindly thank the University Hospital of Santa Maria and especially the staff of Clinical Analysis and Pathological Anatomy Unit for providing the data for this study and the technical support.
AUTHOR CONTRIBUTIONS
CFD was responsible for the study design, data collection and analysis, statistical analysis, and drafting of the paper.
LBC was responsible for data analysis and drafting of the paper.
JBCN and FGN was responsible for data analysis and reviewing the paper.
JAMC was responsible for the study design, statistical analysis, and reviewing the paper.
CP was responsible for the study design, data analysis, statistical analysis, and reviewing the paper.
REFERENCES
- Lun MP, Monuki ES, Lehtinen MK. Development and functions of the choroid plexus–cerebrospinal fluid system. Nat Rev Neurosci. 2015 Aug 15;16(8):445–57.
- Liu G, Ladrón-de-Guevara A, Izhiman Y, Nedergaard M, Du T. Measurements of cerebrospinal fluid production: a review of the limitations and advantages of current methodologies. Fluids Barriers CNS. 2022 Dec 15;19(1):101.
- Spector R, Robert Snodgrass S, Johanson CE. A balanced view of the cerebrospinal fluid composition and functions: Focus on adult humans. Exp Neurol. 2015 Nov;273:57–68.
- Dyckhoff-Shen S, Bewersdorf JP, Teske NC, Völk S, Pfister HW, Koedel U, et al. Characterization and diagnosis spectrum of patients with cerebrospinal fluid pleocytosis. Infection. 2024 Feb 1;52(1):219–29.
- Shahan B, Choi EY, Nieves G. Cerebrospinal Fluid Analysis. Am Fam Physician. 2021 Apr 1;103(7):422–8.
- Hasbun R, Bijlsma M, Brouwer MC, Khoury N, Hadi CM, van der Ende A, et al. Risk score for identifying adults with CSF pleocytosis and negative CSF Gram stain at low risk for an urgent treatable cause. Journal of Infection. 2013 Aug;67(2):102–10.
- Otto F, Harrer C, Pilz G, Wipfler P, Harrer A. Role and Relevance of Cerebrospinal Fluid Cells in Diagnostics and Research: State-of-the-Art and Underutilized Opportunities. Diagnostics. 2021 Dec 30;12(1):79.
- Kestenbaum LA, Ebberon J, Zorc JJ, Hodinka RL, Shah SS. Defining cerebrospinal fluid white blood cell count reference values in neonates and young infants. Pediatrics. 2010 Feb;125(2):257-64.
- Seehusen DA, Reeves MM, Fomin DA. Cerebrospinal fluid analysis. Am Fam Physician. 2003 Sep 15;68(6):1103-8.
- Mapunda JA, Tibar H, Regragui W, Engelhardt B. How Does the Immune System Enter the Brain? Front Immunol. 2022 Feb 22;13.
- Baunbæk Egelund G, Ertner G, Langholz Kristensen K, Vestergaard Jensen A, Benfield TL, Brandt CT. Cerebrospinal fluid pleocytosis in infectious and noninfectious central nervous system disease. Medicine. 2017 May;96(18):e6686.
- Brown B, Fidell A, Ingolia G, Murad E, Beckham JD. Defining diagnostic approaches and outcomes in patients with inflammatory CSF: A retrospective cohort study. Clin Neurol Neurosurg. 2018 Sep;172:105–11.
- Tumani H, Petereit HF, Gerritzen A, Gross CC, Huss A, Isenmann S, et al. S1 guidelines “lumbar puncture and cerebrospinal fluid analysis” (abridged and translated version). Neurol Res Pract. 2020 Dec 16;2(1):8.
- Fouad R, Khairy M, Fathalah W, Gad T, El-Kholy B, Yosry A. Role of Clinical Presentations and Routine CSF Analysis in the Rapid Diagnosis of Acute Bacterial Meningitis in Cases of Negative Gram Stained Smears. J Trop Med. 2014;2014:1–7.
- Jaijakul S, Salazar L, Wootton SH, Aguilera E, Hasbun R. The clinical significance of neutrophilic pleocytosis in cerebrospinal fluid in patients with viral central nervous system infections. International Journal of Infectious Diseases. 2017 Jun;59:77–81.
- Chen Y, Shi ZW, Strickland AB, Shi M. Cryptococcus neoformans Infection in the Central Nervous System: The Battle between Host and Pathogen. Journal of Fungi. 2022 Oct 12;8(10):1069.
- Deak D, Gorcea-Andronic N, Sas V, Teodorescu P, Constantinescu C, Iluta S, et al. A narrative review of central nervous system involvement in acute leukemias. Ann Transl Med. 2021 Jan;9(1):68–68.
- Staal SL, Olie SE, ter Horst L, van Zeggeren IE, van de Beek D, Brouwer MC. Granulocytes in cerebrospinal fluid of adults suspected of a central nervous system infection: a prospective study of diagnostic accuracy. Infection. 2024 Mar 23;
- Subbarao S, Ribeiro S, Campbell H, Okike I, Ramsay ME, Ladhani SN. Trends in laboratory-confirmed bacterial meningitis (2012–2019): national observational study, England. The Lancet Regional Health – Europe. 2023 Sep;32:100692.
- Zeggay A, Patry I, Chirouze C, Bouiller K. Characteristics and outcomes of cerebrospinal fluid shunt and drain-associated infections. Infect Dis Now. 2023 Apr;53(3):104665.
- Van de Beek D, Cabellos C, Dzupova O, Esposito S, Klein M, Kloek AT, et al. ESCMID guideline: diagnosis and treatment of acute bacterial meningitis. Clin Microbiol Infect. 2016 May 1; 22(S3):S37-S62.
- Al-Obaidi MMJ, Desa MNM. Mechanisms of Blood Brain Barrier Disruption by Different Types of Bacteria, and Bacterial-Host Interactions Facilitate the Bacterial Pathogen Invading the Brain. 2018 Oct;38(7):1349-1368.
- Tsamis KI, Sakkas H, Giannakis A, Ryu HS, Gartzonika C, Nikas IP. Evaluating Infectious, Neoplastic, Immunological, and Degenerative Diseases of the Central Nervous System with Cerebrospinal Fluid-Based Next-Generation Sequencing. Mol Diagn Ther. 2021 Mar 1;25(2):207–29.
- Onkarappa S, Panpalia N, Naik K. Retrospective Hospital-based Study of Opportunistic Neuroinfections in HIV/AIDS. Neurol India. 2020;68(4):875.
- Coronell-Rodriguez W, Caceres DC, Cintra O, Guzman-Holst A. Epidemiology of Invasive Meningococcal Disease in Colombia: A Retrospective Surveillance Database Analysis. Infect Dis Ther. 2023 Dec 15;12(12):2709–24.
- Silva LR da, Arruda LES de, Barreto I de JB, Aragão JVR de, Silva MLFI da, Lira G, et al. Geografia e saúde coletiva: análise da dinâmica epidemiológica das meningites no Brasil, entre os anos de 2010 e 2019. Rev Bras Epidemiol. 2024;27.
- Pereira LB et. al. Perfil laboratorial liquórico de pacientes com meningite atendidos em um hospital da região metropolitana de Porto Alegre/RS – Brasil. Revista da AMRIGS. 2021;65(4).
- Franco-Paredes C, Lammoglia L, Hernández I, Santos-Preciado JI. Epidemiology and outcomes of bacterial meningitis in Mexican children: 10-year experience (1993-2003). Int J Infect Dis. 2008 Jul;12(4):380-6.
Correspondence
Clóvis Paniz
E-mail: [email protected]