Comparative study of glomerular filtration rates estimated from serum cystatin C and serum creatinine in the follow-up of renal function in patients with neurogenic bladder due to HTLV-I infection
Estudo comparativo das taxas de filtração glomerular estimada através da cistatina C e creatinina séricas no acompanhamento da função renal dos pacientes com bexiga neurogênica por HTLV-I
Luciana Guedes Araújo1, José Catita2, Sérgio Barreira3, Alfredo Carlos Silva1, Elaine Coutinho Neto1
1 Rede Sarah de Hospitais, Patologia Clínica. Salvador, BA – Brasil.
2 Universidade Fernando Pessoa, Faculdade de Ciências da Saúde. Porto, Norte de Portugal, Portugal; Paralab SA, Valbom, Norte de Portugal, Portugal.
3 Universidade Fernando Pessoa, Faculdade de Ciências da Saúde – Porto, Norte de Portugal, Portugal.
Recebido em 28/08/2022
Aprovado em 30/01/2023
DOI: 10.21877/2448-3877.202300067
INTRODUCTION
Human T-cell leukemia virus type-1 (HTLV-1) is an oncogenic human retrovirus that infects 10-20 million people all over the world. It is endemic in parts of the world including the Caribbean, parts of central Africa, southern parts of the United States and Brazil.(1) HTLV-1 causes diseases with different clinical outcomes such as adult T-cell leukemia/lymphoma,(2) and inflammatory neurologic disease, mainly HTLV-1 Associated Myelopathy/Tropical Spastic Paraparesis (HAM/TSP).(3) The later is insidious and progressive. It is characterized by unremitting myelopathic symptoms such as spastic paraparesis, lower limb sensory disturbance, and bladder/bowel dysfunction.(4) The neurogenic bladder originates from the thoracolumbar impairment expressed as hyperactivity of the detrusor bladder muscle. It is a risk factor for chronic kidney disease.(5,6)
For many decades, renal failure has been the factor with the greatest implication on morbidity and mortality of patients with spinal cord injury.(7) This makes the search for markers sensitive to the first signs of impaired kidney function in patients with HAM/TSP an important challenge for laboratory medicine.(5,7) The glomerular filtration rate (GFR) is considered the best overall index of kidney function in health and disease. GFR cannot be measured easily in clinical practice though. Instead, GFR is estimated from equations using serum creatinine and cystatin C, age, race, sex and body size.(8,9)
In clinical practice, the Cockcroft-Gault and MDRD (Modification of Diet in Renal Disease) formulas are still widely used but have recognized limitations for certain populations.(10,11) More recently, the Chronic Kidney Disease Epidemiology (CKD-EPI) consortium has proposed a group of novel equations for estimating glomerular filtration rate (Table 1) which are included in the Kidney Disease: Improving Global Outcomes (KDIGO) association guidelines since 2013.(12)
These are currently widely recommended by medical societies and are reported in the literature as the formulas that provide better GFR estimation with the advantage of being able to use both creatinine and cystatin C alone or combined for the calculation.(13-17)
This work is, to the best of our knowledge, the first study to evaluate the performance of the CKD-EPI formulas in estimating glomerular filtration rates for adult patients with HTLV-associated myelopathy/tropical spastic paraparesis (HAM/TSP) with the objective to assess which one yields the most reliable GFR estimate for this group of patients.
Table 1
CKD-EPI equations for estimating GFR.
| Basis of equation | Equation for estimating GFR |
| CKD-EPI creatinine
(CDK-EPIScr) |
141 x min (Scr/k, 1)α x max (Scr/k, 1)-.1209 x 0.993Age [x 1.018 if female][x 1.159 if black]
Where Scr is serum creatinine, k is 0.7 for females and 0.9 for males, α is -0.329 for females and -0.411 for males, min is the minimum of Scr/k or 1, and max is the maximum of Scr/k or 1. |
| CKD-EPI cystatin C
(CDK-EPIcys) |
133 x min (Scys/0.8, 1)-0.499 x max (Scys/0.8, 1)-1.328 x 0.996Age [x 0.932 if female]
Where Scys is serum cystatin C, k is 0.7 for females and 0.9 for males, α is -0.329 for females and -0.411 for males, min is the minimum of Scys/k or 1, and max is the maximum for Scys/k or 1. |
| CKD-EPI creatinine-cystatin C
(CDK-EPIScr-cys) |
135 x min (Scys/k, 1)α x max (Scys/k, 1)-0.601 x min (Scys/0.8, 1)-0.375 x max (Scys/0.8, 1)-0.711 x 0.995Age [x 0.969 if female][x 1.08 if black]
Where Scr is serum creatinine, Scys is serum cystatin C, k is 0.7 for females and 0.9 for males, α is -0.248 for females and -0.207 for males, min is the minimum of Scr/k or 1, and max is the maximum of Scr/k or 1. |
MATERIALS AND METHODS
Study design
This retrospective longitudinal study was conducted using information collected at the SARAH Salvador Hospital (Bahia, Brazil) from 2002 to 2018 through the evaluation of laboratory data in electronic medical records of adult patients with HAM/TSP. This study was approved by the ethics committees of the Rede Sarah de Hospitais, Brazil and of the University Fernando Pessoa, Portugal.
Data collection
The laboratory data was obtained from 535 medical records of adult patients with HTLV-I. Inclusion criteria were: age range between 16 and 60 years; clinical signs compatible with paraparesis and myelopathy; positive result for HTLV-I in serum and CSF samples; analytical results of serum creatinine and cystatin C obtained on the same day and diagnosis of neurogenic bladder confirmed by the urologist. Individuals with pre-existing diseases with repercussion in reduced renal function, individuals outside the established age range and patients in whom the diagnosis of neurogenic bladder or HTLV-I myelopathy was not well established following the criteria of the “Guia do Manejo Clínico da infecção por HTLV”(18) were excluded from the study.
In the end, a group of 174 individuals who performed a total of 847 creatinine and cystatin C tests was selected. It was also possible to select a study control group composed of 32 individuals with asymptomatic HTLV-I who performed 44 creatinine and cystatin C tests.
Statistical Methods
The laboratory data for creatinine and cystatin C were mathematically treated to be used in the CKD-EPI formulas.
The GFR results revealed to be non-normally distributed (Kolmogorov-Smirnov normality test), hence non-parametric tests were used in the statistical analysis. This analysis was performed using the SPSS® software version 26.0 (Statistical Package for the Social Sciences -IBM, Armonk, NY, USA), considering a significance level of 0.05 for all tests.
Ethical standards
Compliance with ethical standards
- Research involves human and/or animal participation: No, the study involves retrospective database analysis.
- Informed Consent: I accept waiver of informed consent by the Hospital Ethics Committee (CEP number 3.281.307)
RESULTS
Table 2 shows the result of the comparison of the Cases and Control groups, considering the gender and age variables. As can be seen, no statistically significant differences were found between the two groups with regard to these variables.
The estimated GFRs based on the laboratory data of serum creatinine and cystatin C using the three CKD-EPI formulas are compared in Table 3. Using the Friedman test, is concluded that there are statistically significant differences between the GFRs estimated by the different CKD-EPI formulas for the cases group (p < 0.01) but not for the control group (p = 0.22). Additionally, it is noted that the CKD-EPI creatinine equation leads to statistically identical GFR estimates for both groups.
The degree of agreement and correlation between the GFRs estimated by the three equations was measured utilizing the Cohen’s Kappa and Cramér’s V2 statistics. As shown in Table 4 the highest agreement was obtained between the GFR results estimated by the CKD-EPI creatinine and the CKD-EPI creatinine-cystatin C equations and the worst agreement and correlation was observed between estimates obtained using the CKD-EPI creatinine and CKD-EPI cystatin C equations.
In order to assess the impact of the GFR result variation on the clinical evaluation of symptomatic patients, a comparative analysis was performed between the estimated GFRs using the 60 mL/min24h cut-off point. As evidenced in Table 5, the highest number of estimated GFR values for symptomatic patients below the 60 mL/min24h cut-off point was obtained using the CKD-EPI cystatin C formula. Furthermore, based on the results of the chi-square test, we can state that when the CKD-EPI cystatin C equation is used there was a significant association between predicted GFR and disease status (p = 0.01) (p = 0.01).
Table 2
Demographic characterization of the study groups regarding gender and age variables.
| Characteristic | Cases (n=174)
Median [IQR] or (%) |
Controls (n=32)
Median [IQR] or (%) |
p |
| Age (years) | 49 [13.1] | 50 [21.1] | 0.56† |
| Gender
Women Men |
124 (71) 50 (29) |
24 (75) 8 (25) |
0.66‡ |
† Median test; ‡ Chi-square test.
Table 3
Comparison of GFRs estimated by the different CKD-EPI formulas for the case and control patients.
| Group | CKD-EPI equation used for estimating GFR | Average GFR/ml/min 24h | IC 95% GFR/ml/min 24h |
|
Cases |
CKD-EPIcys1 | 83.2 | 81.4 – 84.9 |
| CKD-EPIScr-cys2 | 93.4 | 91.7 – 95.1 | |
| CKD-EPIScr3 | 105.1 | 103.4 – 106.1 | |
|
Controls |
CKD-EPIcys1 | 103.5 | 97.4 – 109.6 |
| CKD-EPIScr-cys2 | 105.0 | 98.3 – 111.7 | |
| CKD-EPIScr3 | 102.5 | 95.5 – 102.2 |
1U = 27231.5, p < 0.01; 2U = 23196.0, o = 0.01; 3U = 16746.0, p = 0.26.
Table 4
Inter-rater agreement and correlation analysis of the CKD-EPI formulas.
| CKD-EPI equations | Cohen’s Kappa
K (n); p; Classification |
Cramér’s V2
V2 (n); p; Classification |
| CKD-EPIcys
versus CKD-EPIScr-cys |
0.61 (891); <0.01; Substantial agreement | 0.65 (891); <0.01; Moderate |
| CKD-EPIcys
versus CKD-EPIScr |
0.40 (891); <0.01; Fair agreement
|
0.45 (891); <0.01; Moderate |
| CKD-EPIScr-cys
versus CKD-EPIScr |
0.69 9891); <0.01; Substantial agreement | 0.72 (891); <0.01; Strong |
Table 5
Comparative analysis between cases and controls considering the cut-off point of 60mL/min 24h.
| Equation | ||||||
| Estimated GFR | CKD-EPIcys | CKD-EPIScr-cys | CKD-EPIScr | |||
| Cases | Controls | Cases | Controls | Cases | Controls | |
| ≥60ml/min 24h | 698 (82%) | 43 (98%) | 771 (91%) | 43 (98%) | 806 (95%) | 43 (98%) |
| <60ml/min 24h | 149 (18%) | 1 (2%) | 76 (9%) | 1 (2%) | 41 (5%) | 1 (2%) |
| Chi-square independent test results | χ2=7.01, p = 0.01 | χ2 = 2.38, p = 0.12 | χ2 = 0.61, p = 0.43 | |||
Using the classification proposed by KDIGO 2012 it is possible to distribute the estimated GFR as shown in Figure 1, confirming that CKD-EPI cystatin C produces systematically lower GFR estimates when compared to the data obtained by the other CKD-EPI formulas studied.
High and moderate degrees of agreement were observed between the staging predicted by the CKD-EPIcys and CKD-EPIScr-cys formulas for categories G1 (97%), G2 (57%), G4 (79%) and G5 (75%). The agreement percentages drop to 18% and 14% in the G3a and G3b categories, respectively. The agreement between GFR data between formulas CKD-EPIcys and CKD-EPIScr is worse in almost all categories except G1 (92%). The comparative analysis between the CKD-EPIScr and CKD-EPIScr-cys formulas showed a better agreement in the G1 and G2 categories (75% and 72%), even so, lower than that observed in the staging predicted by the CKD-EPIcys and CKD-EPIScr-cys. However, a better agreement was observed in the G3a category. Despite having presented agreements between 57% and 100% in the G4 and G5 categories, the reduction in the number of data analyzed does not allow any objective or relevant inference.
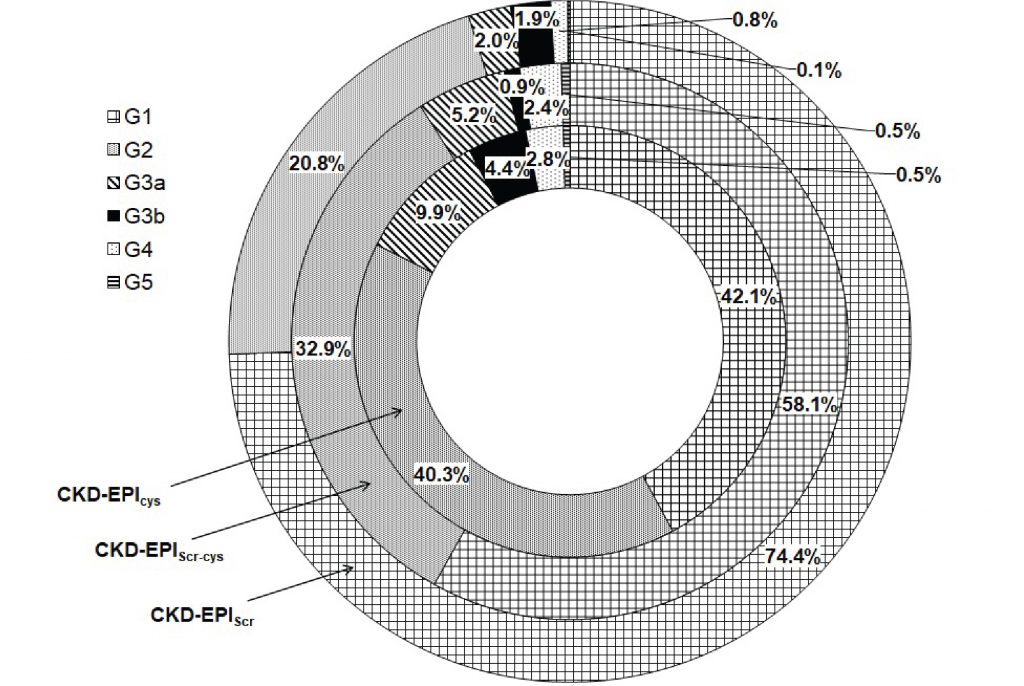
Figure 1
Categorization of the estimated GFR values (ml/min per 1.73 m2) using KDIGO 2012 staging.
DISCUSSION AND CLINICAL REPERCUSSION
The early detection of kidney disease is essential in the clinical follow-up of patients with neurogenic bladder. This makes the identification of a laboratory marker that allows assessment of the first signs of the disease, desirable.(2) In this sense serum creatinine and cystatin C, are particularly useful because they allow the estimation of GFR, considered the best overall index of kidney function, without the need to collect 24-hour urine or use invasive methods with exogenous markers.(9,19) The challenge associated with using the GFR is that the different formulas currently used to estimate GFR can lead to disparate values which can create uncertainty in assessing kidney function. Several studies have already pointed out differences in the performance of the CKD-EPI formulas according to the population profile.(20,21) MacDiarmid and collaborators conducted a study with individuals with spinal cord injury, and concluded that the GRF estimates obtained from the Cockcroft-Gault formula did not correlate with the gold standard.(22) This led those researchers to recommend the use of urinary creatinine determination as an option for estimating GFR for those patients. Macdiarmid and collaborators argued that the medullary filtration rate could be reduced without changing the serum creatinine associated with the age factor.(22) Stevens conducted studies with CKD patients and concluded that the GFR equations that employ cystatin C are more accurate.(20) This research also showed that the CKD-EPI creatinine-cystatin C equation was more reliable for some age groups. Van Deventer and collaborators in studies conducted with South African individuals with various comorbidities such as high blood pressure, diabetes and HIV also concluded that CKD-EPI cystatin C formula produces more reliable GFR estimates.(23)
According to the literature, the determination of GFR based on creatinine is more imprecise when applied to patients with reduced muscle mass.(17,22) In the studied population, there is a reduction in muscle mass as a consequence of HTLV-associated paraparesis.(24) This fact may explain the worse performance of the joint cystatin and creatinine formula evidenced by the results, especially in the G3 stages and also the overestimation of the GFR by the creatinine formula for the categories G1, G2, G3a , G3b and G4 when compared to the cystatin C formula.
As demonstrated by studies, in the present work, the ability of the CKD-EPI cystatin C formula to detect early GFR reduction was also evidenced, especially in the staging ranges with greater renal impairment. In any case, it will be necessary to make a comparison with a gold standard in order to unequivocally demonstrate this better predictive power.
CONCLUSIONS
Patients with spinal cord injury and neurogenic bladder require close monitoring of renal function because of the risk of developing chronic kidney disease. Thus, early laboratory diagnosis and clinical evaluation are crucial for clinical follow-up and prevent the onset of cardiovascular complications with an impact on mortality. The findings of the present study indicate that the GFRs estimated using cystatin C are systematically lower, showing that GFR estimated from the CKD-EPI cystatin C equation is a better predictor of renal function in patients with HAM/TSP and neurogenic bladder. The imprecision of the formulae based on creatinine seem to be linked with the muscle mass loss and decrease in mobility that afflicts patients with HAM/TSP.
LIMITATIONS
This study was carried out in a single rehabilitation hospital in the city of Salvador. Due to the racial miscegenation in the state of Bahia the black race was assumed to calculate the creatinine-dependent GFRs. The data obtained in this study did not show a homogeneous distribution in the result ranges, having a small number of GFR values in the lower classification ranges. It was not possible to use the gold standard for the determination of GFR due to the scarcity of available data.
ACKNOWLEDGEMENTS
To the SARAH Network of Hospitals and Fernando Pessoa University for the support of the professional team and academic support.
Authors’ contribution indication-Taxonomy CRediT
Araújo, Luciana: Conceptualization (leadership), Data curation (equal), Formal Analysis (supporting), Investigation, Methodology (equal), Project administration (equal), Original draft writing. Catita, José: Methodology (equal), Project administration (equal), Supervision (equal), Writing-reviewing and editing (equal). Barreira, Sérgio: Methodology (equal), Project administration (equal); Supervision (equal), Writing-reviewing and editing (equal). Santos, Alfredo: Data curation (equal), Formal Analysis (leadership). Coutinho, Elaine: Conceptualization (supporting), Formal Analysis (supporting), Methodology (equal).
REFERENCES
- Gessain A, Cassar O. Epidemiological Aspects and World Distribution of HTLV-1 Infection. Front Microbiol. 2012;3(NOV):388.
- Proietti AB de F. HTLV. 6. ed. atu. Belo Horizonte: Fundação Hemominas; 2015. 480 p. (Cadernos Hemominas ; v. 16).
- Bangham CRM, Araujo A, Yamano Y, Taylor GP. HTLV-1-associated myelopathy / tropical spastic paraparesis. Nat Rev Dis Prim. 2015 Jun 18;1(1):1-17.
- Yamano Y, Sato T. Clinical pathophysiology of human T-lymphotropic virus-type 1-associated myelopathy/tropical spastic paraparesis. Front Microbiol. 2012;3:389.
- Andrade RCP de. Fisioterapia pélvica em pacientes infectados pelo vírus linfotrópico das células t humano do tipo 1 (HTLV -1) com disfunção vésico-uretral. Universidade Federal da Bahia. Faculdade de Medicina da Bahia; 2015.
- Mingat N, Villar E, Allard J, Castel-Lacanal E, Guillotreau J, Malavaud B, et al. Prospective Study of Methods of Renal Function Evaluation in Patients With Neurogenic Bladder Dysfunction. Urology. 2013 Nov;82(5):1032-7.
- Weld KJ, Wall BM, Mangold TA, Steere EL, Dmochowski RR. Influences on renal function in chronic spinal cord injured patients. J Urol. 2000;164(5):1490-3.
- Stevens LA, Coresh J, Greene T, Levey AS. Assessing Kidney Function –Measured and Estimated Glomerular Filtration Rate. N Engl J Med. 2006 Jun 8;354(23):2473-83.
- Kirsztajn GM, Salgado Filho N, Draibe SA, Pádua Netto MV de, Thomé FS, Souza E, et al. Fast Reading of the KDIGO 2012: Guidelines for evaluation and management of chronic kidney disease in clinical practice. J Bras Nefrol. 2014;36(1):63-73.
- Stevens LA, Coresh J, Feldman HI, Greene T, Lash JP, Nelson RG, et al. Evaluation of the modification of diet in renal disease study equation in a large diverse population. J Am Soc Nephrol. 2007 Oct;18(10):2749-57.
- Chudek J, Kolonko A, Owczarek AJ, Wieczorowska-Tobis K, Broczek K, Skalska A, et al. Clinical factors increasing discrepancies of renal function assessment with MDRD and Cockcroft–Gault equations in old individuals. Eur Geriatr Med. 2018 Oct 1;9(5):713-20.
- KDIGO. KDIGO 2012 Clinical Practice Guideline for the Evaluation and Management of Chronic Kidney Disease. Kidney Int Suppl. 2013;3(1):1-150.
- Abensur H, Yu L, Burdmann EA. A Decade After the KDOQI CKD Guidelines: A Perspective From Brazil. Am J Kidney Dis. 2012 Nov;60(5):738-9.
- Dusse LMS, Rios DRA, Sousa LPN, Moraes RMM e S, Domingueti CP, Gomes KB. Biomarkers of renal function: what is currently available? Rev Bras Análises Clínicas. 2017;49(1):41-51.
- Jadoul M, Wiecek A, Van Biesen W. A Decade After the KDOQI CKD Guidelines: A Perspective From Europe. Am J Kidney Dis. 2012;60(5):743-4.
- Porto JR, Gomes KB, Fernandes AP, Domingueti CP. Avaliação da função renal na doença renal crônica. Rev Bras Análises Clínicas. 2017;49(1):1-17.
- Goto T, Kawasaki Y, Takemoto J, Abe Y, Namima T. Evaluating estimated glomerular filtration rates of creatinine and cystatin C for male patients with chronic spinal cord injury. Spinal Cord. 2018 May 10;56(5):447-52.
- Brasil. Ministério da Saúde. Secretaria de Vigilância em Saúde. Guia de Manejo Clínico da infecção pelo HTLV. Brasilia, DF: Ministerio da Saúde; 2013. 77p.
- Cordeiro, Vania. Estudo comparativo entre a cistatina C e a creatinina como marcadores da taxa de filtração glomerular em crianças portadoras de nefropatias. 2007.
- Stevens LA, Coresh J, Schmid CH, Feldman HI, Froissart M, Kusek J, et al. Estimating GFR Using Serum Cystatin C Alone and in Combination With Serum Creatinine: A Pooled Analysis of 3,418 Individuals With CKD. Am J Kidney Dis. 2008 Mar;51(3):395-406.
- Bhasin B, Lau B, Atta MG, Fine DM, Estrella MM, Schwartz GJ, et al. HIV Viremia and T-cell Activation Differentially Affect the Performance of Glomerular Filtration Rate Equations Based on Creatinine and Cystatin C. Ahuja SK, editor. PLoS One. 2013 Dec 23;8(12):e82028.
- Macdiarmid SASSA, McIntyre WJWWJW, Anthony A, Bailey RRR, Turner JGJ, Arnold EEPE. Monitoring of renal function in patients with spinal cord injury. BJU Int. 2000 Sep;85(9):1014-8.
- Van Deventer HE, Paiker JE, Katz IJ, George JA. A comparison of cystatin C- and creatinine-based prediction equations for the estimation of glomerular filtration rate in black South Africans. Nephrol Dial Transplant. 2011 May;26(5):1553-8.
- Ribas JGR, Melo GCN de. Mielopatia associada ao vírus linfotrópico humanode células T do tipo 1 (HTLV-1). Rev Soc Bras Med Trop. 2002 Aug;35(4):377-84.
Correspondência
Luciana Guedes Araújo
E-mail: [email protected]