
Prediabetes or intermediate hyperglycemia: history, criteria, variability, controversies, and updates
Pré-diabetes ou hiperglicemia intermediária: histórico, critérios, variabilidades, controvérsias e atualizações
Liana Signorini1,2, Christiane Mayrhofer Grocoske de Lima1, Waldemar Volanski2, Ademir Luiz do Prado1,3, Glaucio Valdameri1, Mauren Isfer Anghebem1,4, Vivian Rotuno Moure1, Marcel Henrique Marcondes Sari1, Geraldo Picheth1, Fabiane Gomes de Moraes Rego1
1 Universidade Federal do Paraná, Programa de Pós-graduação em Ciências Farmacêuticas. Curitiba, PR, Brazil.
2 Secretaria de Saúde de Curitiba, Laboratório Municipal. Curitiba, PR, Brazil.
3 Instituto Federal do Paraná, Departamento de Ciência da Computação. Colombo, PR – Brazil.
4 Pontifícia Universidade Católica do Paraná, Escola de Medicina e Ciências da Vida. Curitiba, PR, Brazil.
Received on 10/21/2025
Approved on 01/21/2026
DOI: 10.21877/2448-3877.202600273.en
INTRODUCTION
The concept of prediabetes originated in the late 1970s, aiming to characterize individuals who did not meet the diagnostic criteria for diabetes mellitus (DM) but could not be classified as normal or as being at low risk for the condition.(1,2)
The evolution of diagnostic criteria for DM, which initially used fasting plasma glucose (FPG) and the oral glucose tolerance test (OGTT) as markers, led to the establishment of the concepts of impaired fasting glucose (IFG) and impaired glucose tolerance (IGT).(3,4) Subsequently, the determination of glycated hemoglobin (HbA1c) was incorporated into these tests.(5)
Prediabetes is characterized by laboratory parameters related to plasma glucose concentration, such as FPG, HbA1c, or glucose measured 1 or 2 hours after a 75-g glucose load during the oral glucose tolerance test (1-h OGTT or 2-h OGTT). Prediabetes is associated with an increased risk of several conditions, particularly type 2 diabetes mellitus (T2DM), cardiovascular disease, and stroke. The term prediabetes is also frequently referred to as “intermediate hyperglycemia” and, less commonly, by the synonyms described in Figure 1,(6-8) which shows the main characteristics that support the concept of prediabetes, as well as terms used over the years for this category.
From a clinical perspective, individuals classified as prediabetic present a higher risk not only of progression to T2DM, with mean annual rates of 5% to 10%, but also of cardiovascular disease, nonalcoholic fatty liver disease, early nephropathy, and early-stage retinopathy.(9,10) The heterogeneity of this group, together with the influence of analytical and biological variability, reinforces the challenge of establishing robust and comparable diagnostic criteria.(11)
In this context, the present integrative review aims to synthesize the historical evolution and current criteria for the diagnosis of prediabetes, discuss the advantages and limitations of the biomarkers used, explore the impact of biological and analytical variability on prevalence, and finally present the main associated complications, with emphasis on recent recommendations. The search was conducted in medical databases, including Medline, Lilacs, and Scopus, among others, without chronological restriction, using the following descriptors in English and Portuguese: glycemia, prediabetes, intermediate hyperglycemia, analytical variability, biological variability, diagnosis of prediabetes, prevalence of prediabetes, and treatment of prediabetes.
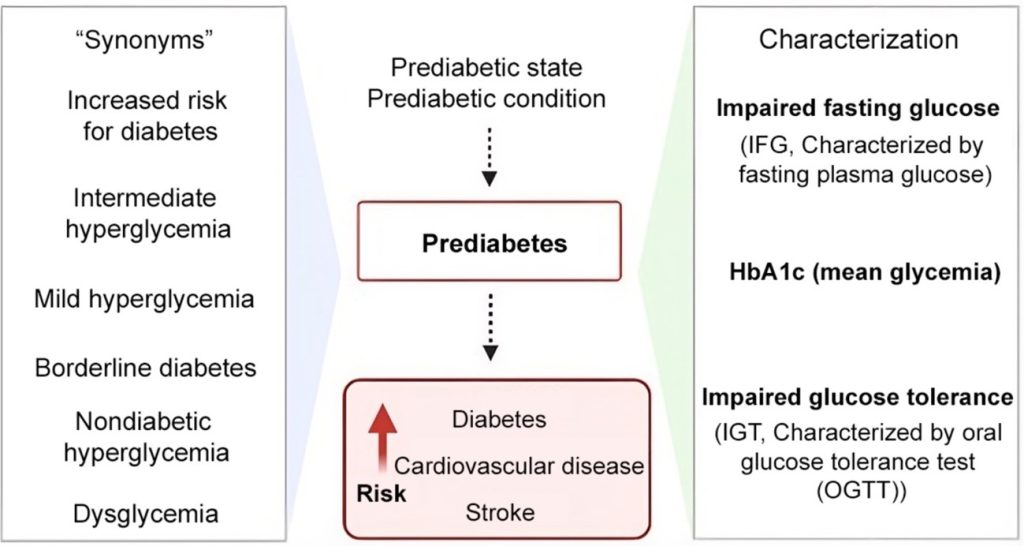
Figure 1
Main characteristics of prediabetes.
Source: Authors.
DEFINITIONS OF PREDIABETES
The concept of prediabetes has been developed over the last five decades, with continuous evolution, progressively incorporating epidemiological, metabolic, molecular, and laboratory findings in the characterization of this group.(2,12,13)
- Prediabetes is defined as glucose levels above the “normal” reference range but below the criteria required to establish the diagnosis of diabetes.(7)
- The terms prediabetes and intermediate hyperglycemia are used to describe impaired glucose tolerance or impaired fasting glucose.(7)
- Individuals with prediabetes have an increased risk of developing T2DM, cardiovascular disease, and stroke.(7)
- Prediabetes characterizes individuals with mild hyperglycemia who do not meet the criteria for diabetes, defined by mild dysglycemia occurring in impaired fasting glucose (IFG) or in the presence of mild hyperglycemia after OGTT, designated impaired glucose tolerance (IGT), without fulfilling the criteria for diabetes.(8)
- Prediabetes is an intermediate state of hyperglycemia with glycemic parameters above normal but below the criteria for diabetes.(14)
Table 1 summarizes the historical evolution of the concept of prediabetes through its main milestones.
LABORATORY CRITERIA FOR THE CHARACTERIZATION OF PREDIABETES
Guidelines published by different scientific societies that define criteria for the diagnosis of prediabetes show relevant divergences. Table 2 presents the diagnostic criteria for the characterization of prediabetes adopted by international guidelines, highlighting that the World Health Organization (WHO) prefers the term “intermediate hyperglycemia” rather than “prediabetes”.
Table 1
Chronology of the main events associated with the concept of prediabetes.
| Year | Comments | Ref |
| 1970 | Term used to identify glucose dysregulation | (12) |
| 1979 | NDDG: Used the term prediabetes to designate impaired glucose tolerance (IGT) defined by 2-h OGTT plasma glucose between 140 mg/dL and 199 mg/dL | (15) |
| 1997
1998 |
ADA, WHO: The definition of impaired fasting glucose (IFG) was accepted based on fasting plasma glucose between 110 mg/dL and 125 mg/dL | (16,17) |
| 2003 | ADA: New criterion for IFG with expansion of the range to 100 mg/dL to 125 mg/dL | (3) |
| 2009 | IEC: Recommended the definition of prediabetes using HbA1c (6.0% to 6.4%) | (5) |
| 2010 | ADA, WHO: Introduction of HbA1c in the definition of prediabetes | (18,19) |
| 2025 | ADA, SBD: Introduction of 1-h OGTT glucose (75-g load) as an additional diagnostic criterion (155 mg/dL to 208 mg/dL) | (8) |
ADA: American Diabetes Association; HbA1c: glycated hemoglobin (HbA1c); IEC: International Expert Committee (committee composed of members of the ADA, the European Association for the Study of Diabetes, and the International Diabetes Federation – IDF); IFG: impaired fasting glucose; IGT: impaired glucose tolerance; NDDG: National Diabetes Data Group; SBD: Brazilian Diabetes Society; OGTT: oral glucose tolerance test with a 75-g glucose load; WHO: World Health Organization.
Table 2
Diagnostic criteria for prediabetes in different guidelines.
| Biomarkers | SBD | ADA
KDA |
DCCPG | NICE | WHO | IDF |
| Year | 2025 | 2025 | 2018 | 2012 | 2006 | 2025 |
| FPG, mg/dL | 100 to 125 | 100 to 125 | 110 to 125 | 110 to 125 | 110 to 125 | 110 to 125 |
| HbA1c, % | 5.7 to 6.4 | 5.7 to 6.4 | 6.0 to 6.9 | 6.0 to 6.4 | 6.1 to 6.9 | 5.7 to 6.4 |
| 1h-OGTT 75g, mg/dL | 155 to 208 | – | – | – | – | – |
| 2h-OGTT 75g, mg/dL | 140 to 199 | 140 to 199 | 140 to 199 | 140 to 199 | 140 to 199 | 140 to 199 |
The presence of only one biomarker within the defined criteria is sufficient to characterize prediabetes. SBD: Brazilian Diabetes Society – Brazil(8); ADA: American Diabetes Association – United States(13); KDA: Korean Diabetes Association(20); DCCPG: Diabetes Canada Clinical Practice Guidelines – Canada(21); NICE: National Institute for Health and Care Excellence – United Kingdom(22,23); WHO: World Health Organization – Global(24); IDF: International Diabetes Federation – Global(7); FPG: fasting plasma glucose; HbA1c: glycated hemoglobin (HbA1c); OGTT: oral glucose tolerance test with a 75-g glucose load. Source: Adapted from Davidson MB.(22)
BIOMARKERS FOR THE CHARACTERIZATION OF PREDIABETES
As mentioned above, the biomarkers used in the characterization of prediabetes according to the main guidelines are:
- Fasting plasma glucose: useful for the characterization of impaired fasting glucose (IFG);
- Plasma glucose measured 1 hour after a 75-g oral glucose load, used in some guidelines as an additional marker of abnormal glucose tolerance;
- Glucose measured 2 hours after oral administration of a standard glucose dose, usually 75 g: useful for the characterization of impaired glucose tolerance (IGT);
- Glycated hemoglobin (HbA1c).
Among the biomarkers used in the characterization of diabetes and prediabetes, the OGTT is the oldest laboratory procedure, with approximately one century of use. Over this period, the test has undergone successive revisions regarding sampling times, glucose dose, and interpretation of results.(25)
HbA1c, the most recently incorporated parameter for the diagnosis of prediabetes, became feasible only after methodological standardization.(26)
The combination of fasting plasma glucose (FPG) and HbA1c has been described as a more sensitive and specific screening tool for identifying diabetes and prediabetes in early stages.(27,28) The combined use of FPG and HbA1c in screening for prediabetes provides the benefits of the individual tests and reduces the risk of systematic bias inherent in the isolated use of HbA1c.(29) However, major guidelines do not formally recommend the combined use of biomarkers as a universal screening strategy, maintaining recommendations based on individual parameters, as previously shown in Table 2.
Biomarkers of glycemic status such as fructosamine, glycated albumin, and 1,5-anhydroglucitol are not recommended in current guidelines for the diagnosis of prediabetes.(6,8)
Although capillary glucose obtained by fingertip puncture may be used in screening settings and population studies, particularly when access to laboratory methods is limited, it does not replace plasma glucose obtained from venous samples.(30) Glucometers, although widely used for glycemic control in individuals living with diabetes, generally show inadequate precision and variability for diagnostic purposes.(31)
Guidelines emphasize that the diagnosis of prediabetes should be based on venous samples, preferably plasma, obtained using antiglycolytic agents, and on the measurement of biomarkers performed in clinical laboratories with an established quality-control system.(32)
Advantages and disadvantages of biomarkers for prediabetes
Biomarkers of glycemic status used in the diagnosis of prediabetes present different characteristics in multiple aspects. The concentrations of these biomarkers change continuously over time and according to glycemic fluctuations, without a clear threshold separating normal from pathological values. The correct interpretation of these tests requires knowledge of the advantages and limitations of these parameters. A broader discussion of the characteristics of the main biomarkers can be found in Anghebem et al., 2024,(33) in which the authors discuss the criteria for the diagnosis of diabetes with emphasis on the oral glucose tolerance test. Table 3 presents a summary of these characteristics.
The definition of cutoff values for biomarkers has a significant impact on estimates of prediabetes prevalence. These diagnostic limits contain arbitrary components and have been modified over time, reflecting advances in pathophysiological understanding and international recommendations.(36) Regardless of the criterion adopted, different cutoff points identify groups with only partial diagnostic agreement.(6,12)
Figure 2 shows that the adoption of different HbA1c criteria has a marked impact on the prevalence of prediabetes. The use of the interval from 6% to 6.4%, recommended by the National Institute for Health and Care Excellence (NICE) in the United Kingdom, when compared with the broader limits of 5.7% to 6.4% adopted in the United States(6) and Brazil,(8) increases the prevalence of prediabetes by approximately threefold. A similar effect is observed for FPG in Figure 2 (FPG columns), in which the adoption of 100 mg/dL as the lower limit, instead of 110 mg/dL, also increases by about threefold the proportion of individuals classified as having prediabetes.
It is important to highlight that when all criteria are required simultaneously (Figure 2, ALL column), prevalence decreases substantially to 2.5%, compared with the requirement of only one biomarker meeting the criteria (Figure 2, ONLY-1 column; 51.3%), representing more than a twenty-fold difference in prevalence.
The marked variation in prediabetes prevalence associated with the criteria used makes long-term epidemiological studies difficult, since prevalence will be affected not only by the characteristics of the population studied but also by the diagnostic criterion applied.(6,12)
Table 3
Characteristics of biomarkers for the diagnosis of prediabetes.
| Characteristics | FPG | OGTT | HbA1c |
| Test cost and availability | Low cost and widely available in all laboratories | Higher cost and may not be available in all laboratories | Higher cost and not available in all laboratories |
| Detection of hyperglycemia | Acute measurement; Few hours | Minutes | Chronic mean glycemic exposure ~2 to 3 months earlier |
| Biological variability; CVi (within-subject biological variation) | High | Very high | Low |
| Fasting requirement | Fasting required and timed samples required | No fasting or special patient preparation required | |
| Pre-analytical stability | Poor; requires immediate plasma separation or glycolysis inhibition | Good; sample is stable | |
| Acute factors that may affect results | Food intake, stress, recent illness, physical activity | Not affected by acute glycemic fluctuations | |
| Other individual factors that may affect results | Diurnal variation, medications, alcohol, smoking, bilirubin | Changes in erythrocyte lifespan (e.g., anemia, iron metabolism disorders, splenectomy, blood loss, transfusion, hemolysis, G6PD deficiency, erythropoietin therapy), HIV infection, cirrhosis, renal failure, dialysis, pregnancy | |
| Analytical interferences | Method-dependent: sample handling/processing time, hemolysis, severe hypertriglyceridemia, severe hyperbilirubinemia | Method-dependent: hemoglobin variants (e.g., HbS, HbC), severe hypertriglyceridemia, severe hyperbilirubinemia | |
FPG: fasting plasma glucose; HbA1c: glycated hemoglobin (HbA1c); OGTT: oral glucose tolerance test with a 75-g glucose load. Source: American Diabetes Association Professional Practice Committee(6), Selvin E(34), Sacks DB.(35)
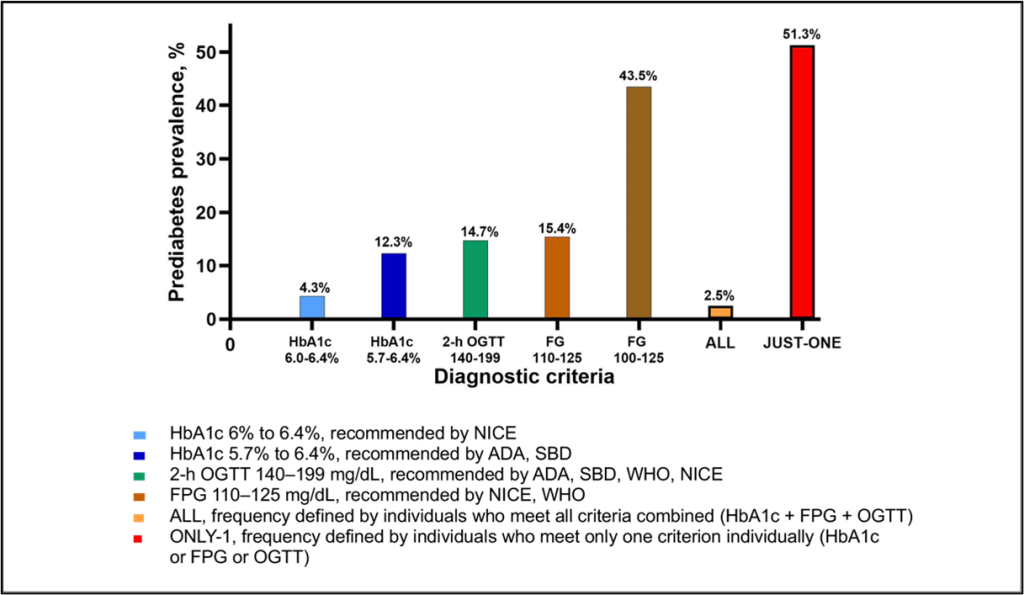
Figure 2
Prevalence of prediabetes according to different criteria.
HbA1c: glycated hemoglobin (HbA1c); 2-h OGTT: glucose measured 2 hours after oral glucose load (75-g OGTT); FPG: fasting plasma glucose; NICE: National Institute for Health and Care Excellence – United Kingdom; ADA: American Diabetes Association – United States; SBD: Brazilian Diabetes Society – Brazil; WHO: World Health Organization – Global; OGTT: oral glucose tolerance test with a 75-g glucose load.
Source: NHANES – National Health and Nutrition Examination Survey 2015–2016, as described by Echouffo-Tcheugui and Selvin, 2021.(12)
PREVALENCE OF PREDIABETES
The International Diabetes Federation (IDF), in its 2025 Atlas, presents global estimates of prediabetes prevalence stratified according to country income level classification.(7)
Brazil is classified by the World Bank as an upper-middle-income economy.(37) As previously mentioned, prediabetes is traditionally defined based on two main diagnostic criteria, and prevalence depends on the cutoff values of these biomarkers, as shown in Table 4.
The Brazilian Longitudinal Study of Adult Health (ELSA-Brazil), conducted between 2008 and 2020 in six Brazilian capitals, included 15,105 participants aged 35 to 74 years.(38) The prevalence of prediabetes observed in this study, according to different diagnostic criteria, is shown in Table 5.
When HbA1c between 5.7% and 6.4% is used, as recommended by ADA and SBD, the prevalence of prediabetes ranges from 5.5% in Ireland to 40.5% in Nigeria.(7) In Brazil, Iser et al. (2020)(40) reported an overall prevalence of 18.5%, with no significant differences between sexes, using the HbA1c criterion of 5.7% to 6.4% (Table 6). The same study showed that when the interval of 6% to 6.4%, recommended by NICE and WHO, was adopted, the prevalence of prediabetes decreased by more than half, to 7.5% (95% CI: 6.7% to 8.3%).
Table 4
Age-adjusted prevalence of prediabetes in adults (20–79 years) according to country income level classification.
| Fasting glycemia
(100 mg/dL to 125 mg/dL) |
2-h OGTT glycemia
(140 mg/dL to 199 mg/dL) |
|||
| Country income* | Prevalence, %
(age-adjusted) |
Number of people (millions) | Prevalence, %
(age-adjusted) |
Number of people (millions) |
| Total | 9.2 | 487,7 | 12.0 | 634,7 |
| High | 8.4 | 83,9 | 10.4 | 108,6 |
| Medium | 9.5 | 381,3 | 12.3 | 491,3 |
| Low | 6.7 | 22,5 | 11.6 | 34,8 |
*World Bank income classification (https://datatopics.worldbank.org/world-development-indicators/the-world-by-income-and-region.html). Criteria used to characterize prediabetes were impaired fasting glucose (IFG) and impaired glucose tolerance (IGT).
Table 5
Prevalence of prediabetes based on data from the ELSA-Brasil study.
| Criteria | Prediabetes prevalence, % | 95% CI |
| Impaired glucose tolerance (IGT)
(2-h OGTT, 140 mg/dL to 199 mg/dL) |
20.3 | 19.7 to 20.9 |
| Impaired fasting glucose (IFG)
(FPG, 100 mg/dL to 125 mg/dL) |
52.6 | 51.8 to 53.4 |
| Impaired fasting glucose (IFG)
(FPG, 110 mg/dL to 125 mg/dL) |
19.1 | 18.5 to 19.7 |
| HbA1c (5.7% to 6.4%) | 16.1 | 15.5 to 16.7 |
| HbA1c (6.0% to 6.4%) | 7.0 | 6.5 to 7.4 |
Impaired glucose tolerance (IGT), criteria recommended by ADA, SBD, and WHO.
Impaired fasting glucose (IFG) between 100 and 125 mg/dL, according to ADA and SBD.
Impaired fasting glucose (IFG) between 110 and 125 mg/dL, according to NICE and WHO.
HbA1c between 5.7% and 6.4%, according to ADA and SBD.
HbA1c between 6% and 6.4%, according to NICE and WHO.
Source: Schmidt MI et al.(39)
Prediabetes prevalence increases with age and with higher body mass index, as shown in Table 6, a result consistent across several studies.(7,40,41) Ethnic characteristics of the population also represent determining factors influencing the prevalence of prediabetes in multiple investigations.(7,42-44) In this context, different regions of Brazil reflect ethnic and cultural variation, which translates into differences in prediabetes prevalence, as shown in the “regions” column of Table 6.
Table 6
Prevalence of prediabetes in the Brazilian population using SBD and ADA criteria based on HbA1c concentration.
| Variables | Criterion: HbA1c 5.7% to 6.4% | |
| Prevalence, % | 95% CI | |
| Total (n= 7548) | 18.5 | 17.4 a 19.7 |
| Age group | ||
| 18 to 39 | 7.8 | 6.6 a 9.2 |
| 40 to 59 | 20.4 | 18.5 a 22.4 |
| >60 | 37.6 | 34.7 a 40.5 |
| BMI | ||
| Underweight/normal weight | 12.4 | 11.0 a 14.0 |
| Overweight | 19.8 | 17.9 a 21.8 |
| Obesity | 20.2 | 17.5 a 23.2 |
| Regions | ||
| North | 14.6 | 13.0 a 16.3 |
| Northeast | 16.4 | 15.0 a 17.9 |
| Southeast | 20.6 | 18.5 a 22.9 |
| South | 16.7 | 14.4 a 19.3 |
| Central-West | 20.2 | 17.5 a 23.2 |
Source: Laboratory data obtained from the National Health Survey (PNS) 2014–2015, as reported by Iser et al., 2021.(40)
EFFECTS OF ANALYTICAL AND BIOLOGICAL VARIABILITY ON PREDIABETES PREVALENCE
The correct interpretation of biomarkers associated with prediabetes must consider variability in results. The main elements affecting biomarker results are:
- Preanalytical variability
a1. Sample stability for glucose measurement or the “glycolysis effect”
a2. Biological variability: intraindividual (CVi) and interindividual (CVg)
- Analytical variability
b1. Analytical imprecision (CVa) or test repeatability
Preanalytical variability: glucose stability — glycolysis
Blood samples for glucose measurement in the characterization of prediabetes must be obtained after fasting (8–10 hours), 1 hour after glucose load (1-h OGTT), or 2 hours after glucose load (2-h OGTT), and preferably collected in the morning, since glucose shows circadian variation.(33,35)
As blood cells, especially erythrocytes and leukocytes, continue to use glucose in the collection tube after sample withdrawal, a continuous decrease in glucose concentration occurs in the sample, referred to as the “glycolysis effect.” In a whole-blood tube without additives that inhibit glycolysis, this loss reaches approximately 5% to 7% (about 10 mg/dL) of the initial glucose concentration per hour.(35) Therefore, blood samples collected for the determination of fasting plasma glucose (FPG) and those obtained during the oral glucose tolerance test (OGTT) must be collected using antiglycolytic agents or undergo rapid plasma/serum separation within less than 30 minutes.(35) Among the anticoagulants routinely used to inhibit glycolysis are sodium fluoride and its combinations with EDTA or oxalate, as well as iodoacetate associated with heparin. These additives do not inhibit glycolysis immediately, allowing the metabolic process to continue for approximately 2 to 4 hours before complete stabilization of glucose concentration, which then remains stable for up to 72 hours after collection.(35,45)
Vacuum collection systems that combine citrate buffer, fluoride, and EDTA inhibit glycolysis immediately and stably and have been recommended for routine laboratory use.(35,46) The rapid acidification of plasma by citrate buffer inhibits glycolysis immediately, and fluoride stabilizes this inhibition.(47) Although these tubes are available on the market, they are not currently used in most laboratories.
Preanalytical variability: Biological variability
Biological variability is defined as the natural fluctuation in the concentration of an analyte within the same individual around a physiological equilibrium point, reflecting homeostatic regulatory mechanisms.(48) Biological variability is expressed statistically by the coefficient of variation (CV), which represents the relationship between the standard deviation (SD, standard deviation) and the mean, calculated by the formula CV = (SD/mean) × 100, expressed as a percentage.
Intraindividual biological variability (CVi) represents the average fluctuation in the concentration of an analyte within the same individual around his or her equilibrium point in response to physiological, hormonal, and environmental stimuli. Interindividual biological variability (CVg), in turn, expresses the extent of variation observed among different individuals in a population.(48)
Table 7 describes the coefficients of variation for analytical and biological variability of prediabetes biomarkers, combining data from different meta-analyses.
When the effect of the intraindividual biological coefficient of variation (CVi) is applied to the lower cutoff values used to characterize prediabetes, it is possible to determine the magnitude of this factor in test interpretation. Figure 3 highlights this effect.
Considering a 95% probability and applying CVi values to the concentrations of 100 mg/dL (FPG), 140 mg/dL (2-h OGTT glucose), and 5.7% (HbA1c), variations of 20 mg/dL, 94 mg/dL, and 0.2%, respectively, are observed. This analysis shows that 2-h OGTT glucose presents the greatest range of variation, followed by FPG, whereas HbA1c demonstrates the lowest fluctuation. Thus, 2-h OGTT glucose exhibits a high degree of biological variability, making it more susceptible to oscillations that may affect the clinical interpretation of results.
Table 7
Analytical and biological variability of biomarkers for prediabetes.
| Parameters | Fasting glycemia | 2-h OGTT glycemia | HbA1c |
| Methodology | Automated enzymatic method | Ion-exchange HPLC | |
| CVa, % (recommended) | ≤2.4 a | <2.5 a | |
| CVa, % (observed) [range] | 2.0 [1.5 a 2.5] | 1.6 [1.1 a 3.0] | |
| CVi, % (95% CI) | 5.0 (4.1 a 12) b | 16.8 (12 a 18.3) c | 1.2 (0.3 a 2.5) b |
| CVg, % (95% CI) | 8.1 (2.7 a 10.8) b | 5.4 (3.3 a 7.3) b | |
Values are presented as coefficients of variation (95% confidence interval). CVa: analytical coefficient of variation (between runs); CVi: intraindividual biological coefficient of variation; CVg: interindividual biological coefficient of variation; 95% CI: 95% confidence interval. Sources: aSacks DB et al.(35), bRicós C et al.(49,50), cJagganathan R et al.(25)
Application of CVi (intraindividual biological coefficient of variation) to the lower cutoff concentrations for the diagnosis of prediabetes recommended by ADA, 2025,(6) and SBD, 2025.(8) CV = (standard deviation/mean) × 100. Two standard deviations encompass 95% of the data in a normal distribution. Sources: Sacks DB(35); Ricós(50)
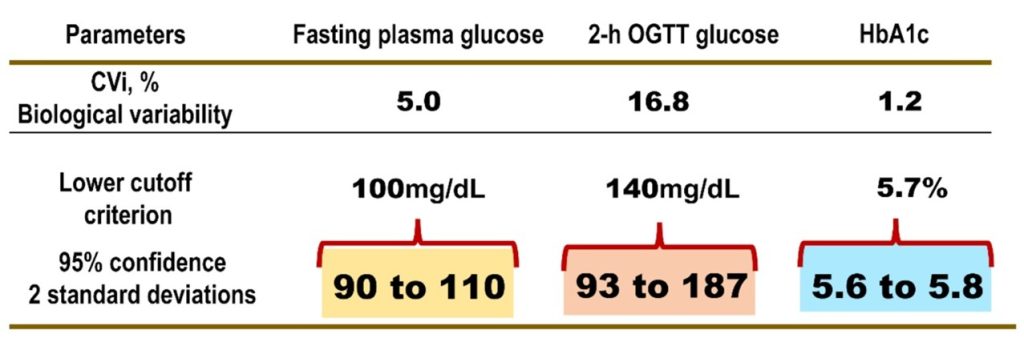
Figure 3
Effect of intraindividual biological variability on cutoff values for the diagnosis of prediabetes.
Analytical variability
Glucose in plasma/serum is quantified in most laboratories by methods using the enzymes glucose oxidase/peroxidase (colorimetric) or hexokinase/glucose-6-phosphate dehydrogenase (ultraviolet). Both methodologies can be automated and are suitable for the characterization of prediabetes and diabetes.(35)
The analytical methodology must be able to accurately reflect the true glucose concentration in the sample. The systematic deviation between the measured value and the true value is referred to as bias and is expressed as a percentage. This parameter can be assessed under actual laboratory conditions using control materials, generally lyophilized or liquid sera, whose reference values are previously established by the manufacturer for different laboratory methods. Bias is calculated from the difference between the true concentration provided by the manufacturer of the control material and that obtained in measurements performed by the laboratory, as illustrated below.
The analytical coefficient of variation (CVa), also referred to as analytical imprecision, is determined in the laboratory from daily internal quality control results, preferably using samples with concentrations close to diagnostic decision points (e.g., 100 mg/dL for glucose) and with at least 20 measurements obtained on different days. Recommendations for acceptable CVa values for glucose and HbA1c (Table 7 – recommended CVa) were established based on intraindividual biological variability (CVi).(51)
Total error (TE), also referred to as total allowable error (TAE), integrates the components of bias and analytical imprecision (CVa), plus the statistical factor 1.65, which corresponds to a 95% confidence level.
TE (%) = bias (%) + 1.65 × CVa (%)
Recommendations for the analytical performance of methodologies used for glucose quantification are presented in Table 8.
Figure 4 describes the central elements for understanding the effect of analytical and biological variability and the statistics applied to describe these effects.
Table 8
Recommendations for analytical performance in glucose quantification.
| Analyte: Glycemia | CVa, % | Bias, % | TE, % | Ref. |
| Recommended | ≤2.4 | ≤2.1 | ≤6.1 | (35, 52-54) |
| Plasma | ≤2.3 | ≤1.8 | ≤5.5 | Westgard* |
| Serum | ≤2.8 | ≤2.34 | ≤6.96 | Westgard* |
CVa, analytical coefficient of variation; Bias, difference between the true value and the obtained value; TE, total error (TE = bias (%) + 1.65 × CVa, %).
*https://westgard.com/clia-a-quality/quality-requirements/biodatabase1.html
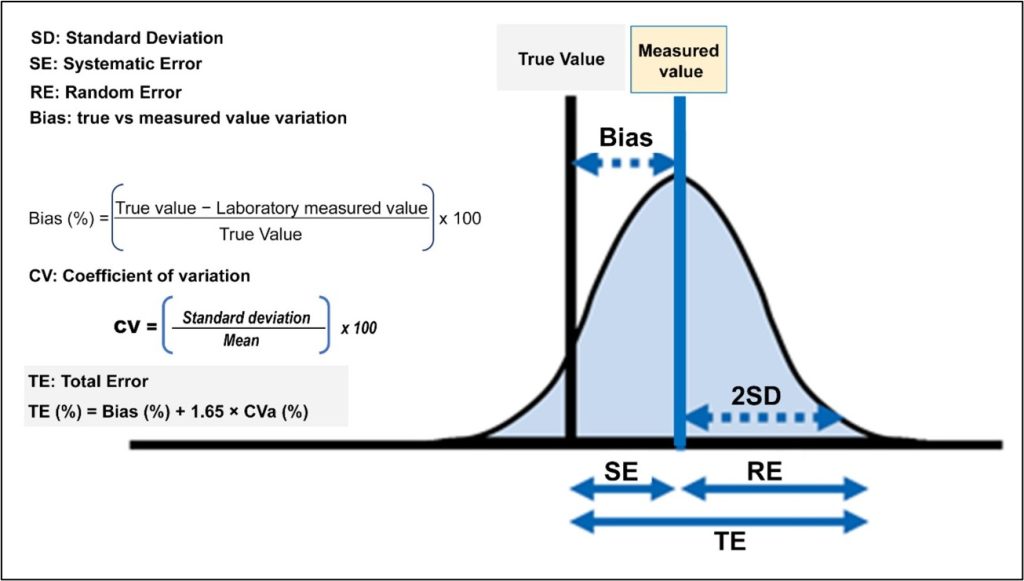
Figure 4
Representation of the main types of variation and statistics associated with biomarker assays.
Source: Adapted from James O. Westgard, Sten A. Westgard. https://myadlm.org/cln/articles/2013/september/total-analytic-error
MAIN COMPLICATIONS ASSOCIATED WITH PREDIABETES
Progression to Type 2 Diabetes
Several studies have evaluated the increased risk of individuals classified as prediabetic progressing to type 2 diabetes mellitus (T2DM). Factors such as older age, male sex, family history of DM, arterial hypertension, and obesity influence the speed of this progression.(55)
Despite the overall consistency of the findings, considerable variation is observed in the quantification and timing of progression. Examples include:
- a) It is estimated that 5% to 10% of individuals with prediabetes progress to T2DM annually;(56)
- b) Approximately 25% of individuals with prediabetes progress to T2DM over a period of 3 to 12 years;(6,57)
- c) Up to 70% of individuals with prediabetes may progress to diabetes over their lifetime;(55)
- d) The rate of progression varies according to ethnicity: in Asian Indians, a phenotype with greater predisposition to T2DM, annual progression is 18.3%, higher than that observed in Chinese individuals (11.3%), Finns (6%), and Americans (11% per person-year).(58)
Zhang et al. (2010), in a systematic study of HbA1c concentration, demonstrated the association between levels of this marker and the risk of developing type 2 diabetes mellitus. The study indicated that HbA1c concentrations between 5.5% and 6.5% are associated with a substantial increase in the risk of progression to diabetes.(59) In the study, the authors reported:
- HbA1c 5% to 5.5%: low risk of diabetes incidence, less than 9% over five years;
- HbA1c 5.5% to 6%: moderate risk of diabetes incidence, between 9% and 25% over five years;
- HbA1c 6% to 6.5%: high risk of diabetes incidence, between 25% and 50% over five years.
A risk criterion for estimating the probability of individuals with prediabetes progressing to T2DM, based on the number of altered biomarkers in each individual, has recently been proposed.(36) Table 9 presents the details of this proposal.
In North American and European cohort studies, individuals with abnormalities in two prediabetes biomarkers (2 criteria; Table 9) present an annual risk of progression to T2DM of approximately 5% to 10%, whereas in those with three altered criteria the risk is greater than 10%.(36) This rate of progression may vary according to the population studied.
Insulin resistance is present in 94% of individuals with simultaneous abnormalities in FPG and 2-h OGTT glucose, in 76% of those with isolated abnormality in 2-h OGTT glucose, and in only 57% of individuals with abnormal FPG.(36)
Table 9
Proposed risk criterion for progression from prediabetes to T2DM.
| Risk for T2DM | Normal | Elevated | High | Very high |
| Number of criteria present | 0 | 1 | 2 | 3 |
| Prediabetes phenotypes | IFG or 2-h OGTT or HbA1c |
IFG + HbA1c or IFG + 2-h OGTT or 2-h OGTT + HbA1c |
IFG + 2-h OGTT + HbA1c |
Criteria: IFG (impaired fasting glucose) 100 mg/dL to 125 mg/dL; 2-h OGTT (impaired glucose tolerance) 140 mg/dL to 199 mg/dL; HbA1c, glycated hemoglobin (HbA1c), 5.7% to 6.4%. Source: Adapted from Kim SH(36).
Other complications associated with prediabetes
Prediabetes is not limited to representing a state of increased risk for the development of T2DM. Several cardiovascular and metabolic complications may already be present at this stage, even before the onset of overt hyperglycemia. Prediabetes represents an intermediate condition between normoglycemia and type 2 diabetes mellitus (T2DM), characterized by metabolic alterations that increase the risk of several systemic complications, summarized below:
- Cardiovascular disease: Individuals with prediabetes are at increased risk of coronary artery disease, stroke, and cardiovascular mortality. Longitudinal studies indicate that the presence of IFG or IGT doubles the risk of cardiovascular events compared with normoglycemic individuals, a risk partially explained by its association with hypertension, atherogenic dyslipidemia, and chronic low-grade inflammation.(60) In addition, prediabetes has been associated with decreased heart rate variability(61)—a marker of parasympathetic function,(62-65)—reduced postural changes in heart rate,(61) increased prevalence of erectile dysfunction in men,(66) and a worse profile in tests of sympathetic and parasympathetic function.(67) Prediabetes is associated with increased risks of important manifestations of vascular disease, but it remains unclear whether the increased disease risk depends on the development of clinical diabetes.(68,69) Cross-sectional studies provide evidence supporting the vascular risk effects of mild or moderate hyperglycemia, since an excess prevalence of coronary artery disease has been reported in individuals with fasting or post-load hyperglycemia below the diabetic threshold.(70) Compared with coronary artery disease, there is less certainty regarding cerebrovascular disease and aortic aneurysm.(70) Diabetes is a known risk factor for ischemic and hemorrhagic stroke, but it has not yet been established whether this risk increases before the development of diabetes, during the prediabetic state.(68)
- Early kidney disease: Prediabetes has been associated with an increased risk of early forms of nephropathy and chronic kidney disease, characterized by microalbuminuria and reduced glomerular filtration rate.(1,71,72) These early renal changes may progress silently, reinforcing the need for screening in at-risk groups.
- Nonalcoholic fatty liver disease (NAFLD): Insulin resistance and metabolic dysfunction present in prediabetes contribute to fat deposition in the liver. Meta-analyses have demonstrated a high prevalence of NAFLD in individuals with prediabetes, with an increased risk of progression to nonalcoholic steatohepatitis (NASH) and fibrosis.(73,74)
- Cognitive impairment and dementia: Increasing evidence indicates that prediabetes is associated with an increased risk of mild cognitive impairment, vascular dementia, and Alzheimer’s disease. Chronic hyperglycemia, even at intermediate levels (prediabetes), may affect cerebral perfusion, neuronal energy metabolism, and promote β-amyloid deposition.(75-77)
- Early microvascular complications: Studies show that retinopathy and neuropathy may be detected in some individuals still classified as prediabetic, suggesting that vascular injury begins before the diagnostic threshold for T2DM.(9,10) Prediabetes may be associated with an increased risk of diabetic retinopathy, although the magnitude of this association varies according to the detection method used.(1,78-82) Recent evidence also points to an increased prevalence of idiopathic polyneuropathy, including sensory or painful neuropathy and small-fiber neuropathy, in individuals with prediabetes.(83-88) In individuals with prediabetes, impaired glucose tolerance (IGT) appears to be more strongly related to painful neuropathy than to nonpainful neuropathy.(83,85,88)
In summary, prediabetes should be regarded not only as a risk phase for T2DM, but also as a clinical condition already associated with multiple metabolic, vascular, and organ complications, as illustrated in Figure 5. This perspective reinforces the relevance of early diagnosis and immediate preventive intervention to reduce the metabolic and vascular impact of this condition and, consequently, the public health burden.
Reversion to normoglycemia
Return to normoglycemia in individuals with prediabetes, or “reversion of prediabetes,” is common and varies across populations, diagnostic criteria used, and other factors that may be associated with studies, such as nutritional counseling and lifestyle guidance.(89)
As an example, in the Whitehall II population-based cohort study, which included more than 10,000 English participants with a mean follow-up of 6.7 years, the 5-year rate of reversion to normoglycemia varied according to the criterion used: 45% for FPG, 37% for 2-h OGTT glucose, and 17% for HbA1c. The authors observed that most prediabetic individuals defined by HbA1c remained in this condition or progressed to T2DM over the 5-year follow-up. Reversion to normoglycemia occurred more frequently among those with prediabetes characterized by abnormalities in FPG or 2-h OGTT glucose. It is worth noting that only reversion according to the 2-h OGTT criterion was associated with a significant reduction in the future risk of cardiovascular disease and mortality.(89)
Another relevant study, conducted by Kowall et al., evaluated an elderly population from southeastern Germany, with a mean age of 69 years, considering changes in body mass index (BMI) and waist circumference (WC).(90) During a mean follow-up of 6.5 years, 27.3% and 9.2% of prediabetic individuals, respectively classified according to ADA criteria for HbA1c and for glycemic parameters (FPG and 2-h OGTT glucose), returned to normoglycemia. Reduction in BMI and WC, even when modest, was associated with a greater probability of reversion to normoglycemia and maintenance of this state over time.
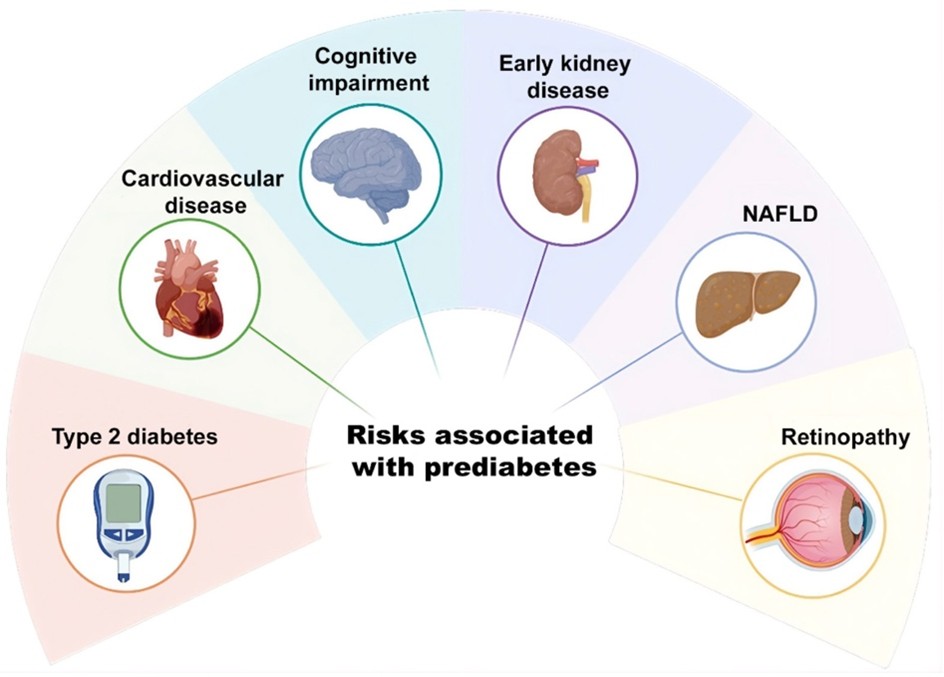
Figure 5
Risks associated with the prediabetic state.
NAFLD: Nonalcoholic fatty liver disease.
Source: Authors.
NONPHARMACOLOGICAL AND PHARMACOLOGICAL THERAPIES FOR PREDIABETES
The management of prediabetes is primarily focused on lifestyle changes, including weight loss, adoption of a balanced diet, and regular physical activity.
Large studies conducted worldwide have shown that these measures are effective in reducing progression to T2DM and are considered the main recommended intervention for individuals with prediabetes. Among the classic clinical trials, the Finnish Diabetes Prevention Study (DPS) included overweight or obese individuals with prediabetes undergoing interventions aimed at achieving ≥5% reduction in body weight, moderate-intensity physical activity for at least 150 minutes per week, reduced fat intake, and increased fiber intake. After three years, the intervention group showed a 58% reduction in progression to diabetes compared with the control group.(91) Similar results were observed in the Diabetes Prevention Program (DPP), in which a 5% to 7% reduction in body weight combined with at least 150 minutes per week of moderate physical activity reduced the risk of progression to T2DM by up to 58%.(92)
Clinical trials conducted in individuals with impaired glucose tolerance (IGT) have shown that metformin can reduce the risk of developing type 2 diabetes mellitus (T2DM) by up to 45%.(93) In the Indian DPP-1 study,(26) the effect of metformin was comparable to that of intensive lifestyle intervention, although in the American DPP study it was less effective than behavioral changes.(94) The benefit of metformin was more pronounced in prediabetic individuals with higher body mass index (BMI) and higher baseline fasting plasma glucose (FPG), compared with leaner individuals and those with lower FPG concentrations.(92)
Current evidence reinforces the potential role of pharmacotherapy in the prevention of T2DM, especially among individuals at higher risk of progression. Biguanides, particularly metformin, remain the most studied drugs and show moderate efficacy in preventing the progression of prediabetes, although inferior to that achieved with lifestyle-based interventions.(95,96) Its main mechanism of action is the reduction of hepatic glucose production,(97) in addition to beneficial effects on BMI and lipid profile. Metformin has a favorable safety profile, with no reports of serious adverse events, and gastrointestinal side effects are generally mild to moderate.(92,98,99)
In addition to metformin, several randomized placebo-controlled clinical trials have evaluated the efficacy of different medications, including troglitazone, acarbose, orlistat, pioglitazone, rosiglitazone, ramipril, voglibose, nateglinide, valsartan, and liraglutide, in preventing progression from prediabetes to T2DM.(100) Although some studies have shown favorable results, prediabetes is still not universally recognized as a disease per se, which limits the formal approval of pharmacological or surgical interventions in many countries. Furthermore, the cost-effectiveness and sustainability of these therapies remain uncertain.(14,36,101,102)
In summary, most evidence for the management of prediabetes focuses on lifestyle modification with or without medication in overweight or obese individuals with impaired glucose tolerance, as summarized in Figure 6. It is still unclear whether these interventions are beneficial in individuals with impaired fasting glucose and in those with normal body weight, as well as the cost-effectiveness and sustainability of pharmacotherapy for the treatment of prediabetes. The field remains in evolution, with a need for long-term trials evaluating not only diabetes prevention, but also the impact on cardiovascular, hepatic, and renal complications.
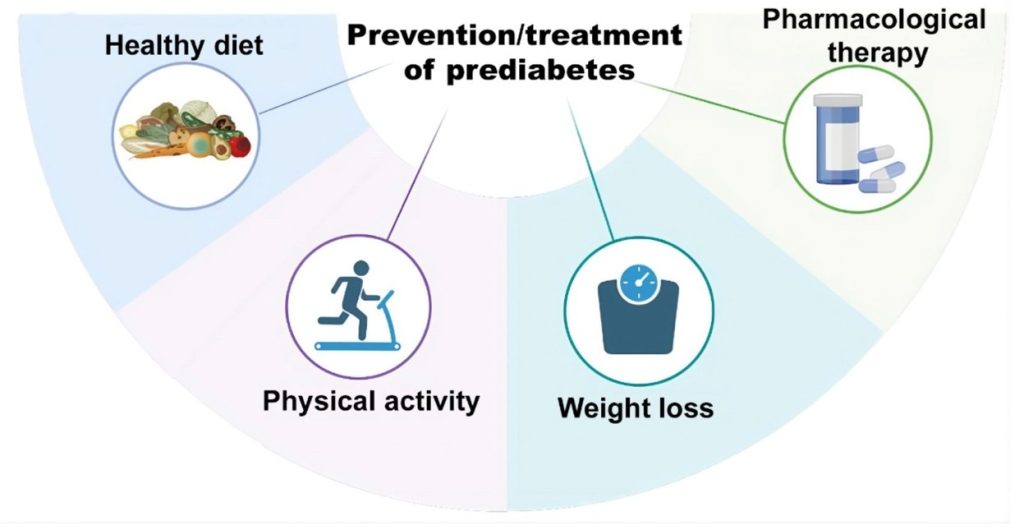
Figure 6
Strategies for the prevention and treatment of prediabetes.
The prevention and management of prediabetes involve lifestyle interventions and, in some cases, the use of pharmacological therapies. The main strategies include adoption of a healthy diet, regular physical activity, and weight reduction, which contribute to improved insulin sensitivity and glycemic control. When behavioral changes are not sufficient, pharmacological therapy may be indicated to delay or prevent progression to T2DM.
Source: Authors.
FINAL CONSIDERATIONS
Prediabetes represents a heterogeneous and dynamic metabolic condition situated along a continuum between normoglycemia and T2DM. More than a simple intermediate phase, prediabetes constitutes an early marker of metabolic dysfunction, reflecting a state in which insulin secretion and action are already altered, thereby signaling an increasing risk of progression to T2DM and of cardiovascular and microvascular complications.
The laboratory biomarkers used to characterize prediabetes—fasting plasma glucose (FPG), plasma glucose during the oral glucose tolerance test (OGTT), and glycated hemoglobin (HbA1c)—present different sensitivities and specificities, reflecting distinct aspects of glycemic homeostasis. These differences, together with their biological and analytical variability, lead to the identification of distinct phenotypic subgroups within the prediabetes spectrum. Among the tests, 2-h OGTT glucose, considered the oldest method and still a diagnostic reference, exhibits the highest intraindividual biological variability, a factor that affects reproducibility and interpretation of the results.
The global prevalence of prediabetes is estimated at 12% when criteria based on the 2-h OGTT are applied and 9.2% when based on fasting plasma glucose (FPG). In Brazil, prevalence varies according to the biomarker used: 20.3% by OGTT (140 mg/dL to 199 mg/dL), 52.6% by FPG (100 mg/dL to 125 mg/dL), and 18.5% by HbA1c (5.7% to 6.4%). These variations demonstrate the influence of diagnostic criteria and population characteristics on epidemiological estimates.
Progression from prediabetes to T2DM occurs at different rates and speeds, depending on genetic, metabolic, and behavioral factors. Conversely, reversion to normoglycemia is a frequent phenomenon, particularly associated with weight reduction, regular physical activity, and the adoption of healthy lifestyle habits. These strategies remain the basis of clinical management, supported by robust scientific evidence of effectiveness.
Pharmacological therapy, notably with metformin, may be considered in specific higher-risk situations, such as in individuals with obesity, impaired glucose tolerance, or a strong family history, although its use is not universally recommended in current guidelines.
Therefore, prediabetes should be understood as a critical window for intervention, in which early identification and preventive action have the potential to interrupt the trajectory toward overt diabetes, representing a decisive opportunity to reduce the global burden of metabolic disease.
FINANCIAL SUPPORT
This study was funded by the Conselho Nacional de Desenvolvimento Científico e Tecnológico (CNPq) (grant numbers 407034/2023-4, 405828/2025-0, and 405828-Universal 2024) and by the Universidade Federal do Paraná (UFPR).
REFERENCES
- Gabir MM, Hanson RL, Dabelea D, Imperatore G, Roumain J, Bennett PH, et al. Plasma glucose and prediction of microvascular disease and mortality: evaluation of 1997 American Diabetes Association and 1999 World Health Organization criteria for diagnosis of diabetes. Diabetes Care. 2000 Aug;23(8):1113-8.
- Davidson MB, Kahn RA. A Reappraisal of Prediabetes. J Clin Endocrinol Metab. 2016 Jul;101(7):2628-35.
- Genuth S, Alberti KGMM, Bennett P, Buse J, Defronzo R, Kahn R, et al. Follow-up report on the diagnosis of diabetes mellitus. Diabetes Care. 2003 Nov;26(11):3160-7.
- Sathyapalan T, Manuchehri AM, Rigby AS, Atkin SL. Subclinical hypothyroidism is associated with reduced all-cause mortality in patients with type 2 diabetes. Diabetes Care. 2010 Mar;33(3):e37.
- International Expert Committee. International Expert Committee report on the role of the A1C assay in the diagnosis of diabetes. Diabetes Care. 2009 Jul;32(7):1327-34.
- American Diabetes Association Professional Practice Committee. 2. Diagnosis and Classification of Diabetes: Standards of Care in Diabetes-2025. Diabetes Care. 2025 Jan 1;48(1 Suppl 1):S27-49.
- International Diabetes Federation. IDF. 2025. p. 1–130 11th Edition IDF Diabetes Atlas.
- Rodacki M, Teles M, Gabbay M, Montenegro R, Bertoluci M. Classificação do diabetes. In: SBD, editor. Diretriz Oficial da Sociedade Brasileira de Diabetes. Conectando Pessoas; 2025.
- Thiab S, Akhal T, Akeblersane M, Sheth H, Atkin SL, Butler AE. Microvascular complications in prediabetes: a systematic review & meta-analysis. Diabetes Res Clin Pract. 2025 Jul;225:112261.
- Gottwald-Hostalek U, Gwilt M. Vascular complications in prediabetes and type 2 diabetes: a continuous process arising from a common pathology. Curr Med Res Opin. 2022 Nov;38(11):1841-51.
- Schlesinger S, Neuenschwander M, Barbaresko J, Lang A, Maalmi H, Rathmann W, et al. Prediabetes and risk of mortality, diabetes-related complications and comorbidities: umbrella review of meta-analyses of prospective studies. Diabetologia. 2022 Feb;65(2):275-85.
- Echouffo-Tcheugui JB, Selvin E. Prediabetes and What It Means: The Epidemiological Evidence. Annu Rev Public Health. 2021 Apr 1;42:59-77.
- Khan RMM, Chua ZJY, Tan JC, Yang Y, Liao Z, Zhao Y. From Pre-Diabetes to Diabetes: Diagnosis, Treatments and Translational Research. Medicina (Kaunas). 2019 Aug 29;55(9).
- Bansal N. Prediabetes diagnosis and treatment: A review. World J Diabetes. 2015 Mar 15;6(2):296-303.
- Buysschaert M, Bergman M. Definition of prediabetes. Med Clin North Am. 2011 Mar;95(2):289-97, vii.
- Report of the Expert Committee on the Diagnosis and Classification of Diabetes Mellitus. Diabetes Care. 1997 Jul;20(7):1183-97.
- Alberti KG, Zimmet PZ. Definition, diagnosis and classification of diabetes mellitus and its complications. Part 1: diagnosis and classification of diabetes mellitus provisional report of a WHO consultation. Diabet Med. 1998 Jul;15(7):539-53.
- American Diabetes Association. Standards of medical care in diabetes 2010. Diabetes Care. 2010 Jan;33 Suppl 1(Suppl 1):S11-61.
- Use of Glycated Haemoglobin (HbA1c) in the Diagnosis of Diabetes Mellitus: Abbreviated Report of a WHO Consultation. Geneva: World Health Organization; 2011.
- Kang S, Kang SM, Choi JH, Ko SH, Koo BK, Kwon HS, et al. 2025 Clinical Practice Guidelines for Diabetes Management in Korea: Recommendation of the Korean Diabetes Association. Diabetes Metab J. 2025 Jul;49(4):582-783.
- Punthakee Z, Goldenberg R, Katz P. Definition, Classification and Diagnosis of Diabetes, Prediabetes and Metabolic Syndrome. Can J Diabetes [Internet]. 2018;42:S10-5. Available from: https://www.sciencedirect.com/science/article/pii/S1499267117308134
- Davidson MB. Historical review of the diagnosis of prediabetes/intermediate hyperglycemia: Case for the international criteria. Diabetes Res Clin Pract. 2022 Mar;185:109219.
- Chatterton H, Younger T, Fischer A, Khunti K, Programme Development Group. Risk identification and interventions to prevent type 2 diabetes in adults at high risk: summary of NICE guidance. BMJ. 2012 Jul 12;345:e4624.
- WHO/IDF Consultation. Definition and diagnosis of diabetes mellitus and intermediate hyperglycemia : report of a WHO/IDF consultation. Geneva; 2006.
- Jagannathan R, Neves JS, Dorcely B, Chung ST, Tamura K, Rhee M, et al. The Oral Glucose Tolerance Test: 100 Years Later. Diabetes Metab Syndr Obes. 2020;13:3787-805.
- John WG, Mosca A, Weykamp C, Goodall I. HbA1c standardisation: history, science and politics. Clin Biochem Rev. 2007 Nov;28(4):163-8.
- Hu Y, Liu W, Chen Y, Zhang M, Wang L, Zhou H, et al. Combined use of fasting plasma glucose and glycated hemoglobin A1c in the screening of diabetes and impaired glucose tolerance. Acta Diabetol. 2010 Sep;47(3):231-6.
- Sequeira IR, Poppitt S. HbA1c as a marker of prediabetes: A reliable screening tool or not? Insights Nutr Metab. 2017;1(1):21-9.
- Okosun IS, Seale JP, Lyn R, Davis-Smith YM. Improving Detection of Prediabetes in Children and Adults: Using Combinations of Blood Glucose Tests. Front Public Health. 2015;3:260.
- Erbach M, Freckmann G, Hinzmann R, Kulzer B, Ziegler R, Heinemann L, et al. Interferences and Limitations in Blood Glucose Self-Testing: An Overview of the Current Knowledge. J Diabetes Sci Technol. 2016 Sep;10(5):1161-8.
- Macleod K, Katz LB, Cameron H. Capillary and Venous Blood Glucose Accuracy in Blood Glucose Meters Versus Reference Standards: The Impact of Study Design on Accuracy Evaluations. J Diabetes Sci Technol. 2019 May;13(3):546-52.
- Kaur G, Lakshmi PVM, Rastogi A, Bhansali A, Jain S, Teerawattananon Y, et al. Diagnostic accuracy of tests for type 2 diabetes and prediabetes: A systematic review and meta-analysis. PLoS One. 2020;15(11):e0242415.
- Anghebem MI, Zonatto CH, Leite JSCT, Marques VM, Toledo Júnior A de O, Rego FG de M, et al. Laboratory tests for diabetes diagnosis with an emphasis on glucose load testing. Revista Brasileira de Análises Clínicas. 2024;56(3):266-77.
- Selvin E. Hemoglobin A1c-Using Epidemiology to Guide Medical Practice: Kelly West Award Lecture 2020. Diabetes Care. 2021 Sep 21;44(10):2197-204.
- Sacks DB, Arnold M, Bakris GL, Bruns DE, Horvath AR, Lernmark Å, et al. Guidelines and Recommendations for Laboratory Analysis in the Diagnosis and Management of Diabetes Mellitus. Clin Chem. 2023 Aug 2;69(8):808-68.
- Kim SH. Reframing prediabetes: A call for better risk stratification and intervention. J Intern Med. 2024 Jun;295(6):735-47.
- World Bank. 2025. World Bank Country and Lending Groups. Available from: https://datahelpdesk.worldbank.org/knowledgebase/articles/906519-world-bank-country-and-lending-groups
- Lotufo PA. [Setting up the longitudinal study for adult health (ELSA-Brasil]. Rev Saude Publica. 2013 Jun;47 Suppl 2:3-9.
- Schmidt MI, Hoffmann JF, de Fátima Sander Diniz M, Lotufo PA, Griep RH, Bensenor IM, et al. High prevalence of diabetes and intermediate hyperglycemia – The Brazilian Longitudinal Study of Adult Health (ELSA-Brasil). Diabetol Metab Syndr. 2014;6:123.
- Iser BPM, Pinheiro PC, Malta DC, Duncan BB, Schmidt MI. Prediabetes and intermediate hyperglycemia prevalence in adults and associated factors, Health National Survey. Cien Saude Colet. 2021 Feb;26(2):531-40.
- Schmidt MI, Bracco PA, Yudkin JS, Bensenor IM, Griep RH, Barreto SM, et al. Intermediate hyperglycaemia to predict progression to type 2 diabetes (ELSA-Brasil): an occupational cohort study in Brazil. Lancet Diabetes Endocrinol. 2019 Apr;7(4):267-77.
- Formagini T, Brooks JV, Roberts A, Bullard KM, Zhang Y, Saelee R, et al. Prediabetes prevalence and awareness by race, ethnicity, and educational attainment among U.S. adults. Front Public Health. 2023;11:1277657.
- Zhu Y, Sidell MA, Arterburn D, Daley MF, Desai J, Fitzpatrick SL, et al. Racial/Ethnic Disparities in the Prevalence of Diabetes and Prediabetes by BMI: Patient Outcomes Research To Advance Learning (PORTAL) Multisite Cohort of Adults in the U.S. Diabetes Care. 2019 Dec;42(12):2211-9.
- Spanakis EK, Golden SH. Race/ethnic difference in diabetes and diabetic complications. Curr Diab Rep. 2013 Dec;13(6):814-23.
- Gambino R. Sodium fluoride: an ineffective inhibitor of glycolysis. Ann Clin Biochem. 2013 Jan;50(Pt 1):3-5.
- Gambino R, Piscitelli J, Ackattupathil TA, Theriault JL, Andrin RD, Sanfilippo ML, et al. Acidification of blood is superior to sodium fluoride alone as an inhibitor of glycolysis. Clin Chem. 2009 May;55(5):1019-21.
- Saracevic A, Dukic L, Juricic G, Milevoj Kopcinovic L, Mirosevic G, Simundic AM. Various glycolysis inhibitor-containing tubes for glucose measurement cannot be used interchangeably due to clinically unacceptable biases between them. Clin Chem Lab Med. 2018 Jan 26;56(2):236-41.
- Sandberg S, Carobene A, Bartlett B, Coskun A, Fernandez-Calle P, Jonker N, et al. Biological variation: recent development and future challenges. Clin Chem Lab Med. 2023 Apr 25;61(5):741-50.
- Ricós C, Alvarez V, Cava F, García-Lario J V, Hernández A, Jiménez C V, et al. Current databases on biological variation: pros, cons and progress. Scand J Clin Lab Invest. 1999 Nov;59(7):491-500.
- Ricós C, Fernández-Calle P, Gonzalez-Lao E, Simón M, Díaz-Garzón J, Boned B, et al. Critical appraisal and meta-analysis of biological variation studies on glycosylated albumin, glucose and HbA 1c. Advances in Laboratory Medicine / Avances en Medicina de Laboratorio. 2020 Oct 6;1(3).
- Biswas SS, Bindra M, Jain V, Gokhale P. Evaluation of Imprecision, Bias and Total Error of Clinical Chemistry Analysers. Indian Journal of Clinical Biochemistry. 2015 Jan 22;30(1):104-8.
- Schrot RJ, Patel KT, Foulis P. Evaluation of Inaccuracies in the Measurement of Glycemia in the Laboratory, by Glucose Meters, and Through Measurement of Hemoglobin A1c. Clinical Diabetes [Internet]. 2007 Apr 1;25(2):43–9. Available from: https://doi.org/10.2337/diaclin.25.2.43.
- Aarsand AK, Díaz-Garzón J, Fernandez-Calle P, Guerra E, Locatelli M, Bartlett WA, et al. The EuBIVAS: Within- and Between-Subject Biological Variation Data for Electrolytes, Lipids, Urea, Uric Acid, Total Protein, Total Bilirubin, Direct Bilirubin, and Glucose. Clin Chem. 2018 Sep;64(9):1380-93.
- González-Lao E, Corte Z, Simón M, Ricós C, Coskun A, Braga F, et al. Systematic review of the biological variation data for diabetes related analytes. Clin Chim Acta. 2019 Jan;488:61-7.
- Makaroff LE. The need for international consensus on prediabetes. Lancet Diabetes Endocrinol. 2017 Jan;5(1):5-7.
- Tabák AG, Herder C, Rathmann W, Brunner EJ, Kivimäki M. Prediabetes: a high-risk state for diabetes development. Lancet. 2012 Jun 16;379(9833):2279-90.
- Giacaglia LR, Barcellos CRG, Genestreti PR, Silva MER da, Santos RF dos, Vencio S, et al. Tratamento farmacológico do pré-diabetes. In: Diretriz Oficial da Sociedade Brasileira de Diabetes. Conectando Pessoas; 2022.
- Sandforth L, Kullmann S, Sandforth A, Fritsche A, Jumpertz-von Schwartzenberg R, Stefan N, et al. Prediabetes remission to reduce the global burden of type 2 diabetes. Trends Endocrinol Metab. 2025 Oct;36(10):899-916.
- Zhang X, Gregg EW, Williamson DF, Barker LE, Thomas W, Bullard KM, et al. A1C level and future risk of diabetes: a systematic review. Diabetes Care. 2010 Jul;33(7):1665-73.
- Cai X, Zhang Y, Li M, Wu JH, Mai L, Li J, et al. Association between prediabetes and risk of all cause mortality and cardiovascular disease: updated meta-analysis. BMJ. 2020 Jul 15;370:m2297.
- Tesfaye S, Boulton AJM, Dyck PJ, Freeman R, Horowitz M, Kempler P, et al. Diabetic neuropathies: update on definitions, diagnostic criteria, estimation of severity, and treatments. Diabetes Care. 2010 Oct;33(10):2285-93.
- Wu JS, Yang YC, Lin TS, Huang YH, Chen JJ, Lu FH, et al. Epidemiological evidence of altered cardiac autonomic function in subjects with impaired glucose tolerance but not isolated impaired fasting glucose. J Clin Endocrinol Metab. 2007 Oct;92(10):3885-9.
- Gerritsen J, Dekker JM, TenVoorde BJ, Bertelsmann FW, Kostense PJ, Stehouwer CD, et al. Glucose tolerance and other determinants of cardiovascular autonomic function: the Hoorn Study. Diabetologia. 2000 May;43(5):561-70.
- Singh JP, Larson MG, O’Donnell CJ, Wilson PF, Tsuji H, Lloyd-Jones DM, et al. Association of hyperglycemia with reduced heart rate variability (The Framingham Heart Study). Am J Cardiol. 2000 Aug 1;86(3):309-12.
- Schroeder EB, Chambless LE, Liao D, Prineas RJ, Evans GW, Rosamond WD, et al. Diabetes, glucose, insulin, and heart rate variability: the Atherosclerosis Risk in Communities (ARIC) study. Diabetes Care. 2005 Mar;28(3):668-74.
- Grover SA, Lowensteyn I, Kaouache M, Marchand S, Coupal L, DeCarolis E, et al. The prevalence of erectile dysfunction in the primary care setting: importance of risk factors for diabetes and vascular disease. Arch Intern Med. 2006 Jan 23;166(2):213-9.
- Putz Z, Tabák AG, Tóth N, Istenes I, Németh N, Gandhi RA, et al. Noninvasive evaluation of neural impairment in subjects with impaired glucose tolerance. Diabetes Care. 2009 Jan;32(1):181-3.
- Emerging Risk Factors Collaboration, Sarwar N, Gao P, Seshasai SRK, Gobin R, Kaptoge S, et al. Diabetes mellitus, fasting blood glucose concentration, and risk of vascular disease: a collaborative meta-analysis of 102 prospective studies. Lancet. 2010 Jun 26;375(9733):2215-22.
- Rao Kondapally Seshasai S, Kaptoge S, Thompson A, Di Angelantonio E, Gao P, Sarwar N, et al. Diabetes mellitus, fasting glucose, and risk of cause-specific death. N Engl J Med. 2011 Mar 3;364(9):829-41.
- Barr ELM, Zimmet PZ, Welborn TA, Jolley D, Magliano DJ, Dunstan DW, et al. Risk of cardiovascular and all-cause mortality in individuals with diabetes mellitus, impaired fasting glucose, and impaired glucose tolerance: the Australian Diabetes, Obesity, and Lifestyle Study (AusDiab). Circulation. 2007 Jul 10;116(2):151-7.
- Hoehner CM, Greenlund KJ, Rith-Najarian S, Casper ML, McClellan WM. Association of the insulin resistance syndrome and microalbuminuria among nondiabetic native Americans. The Inter-Tribal Heart Project. J Am Soc Nephrol. 2002 Jun;13(6):1626-34.
- Metcalf PA, Baker JR, Scragg RK, Dryson E, Scott AJ, Wild CJ. Microalbuminuria in a middle-aged workforce. Effect of hyperglycemia and ethnicity. Diabetes Care. 1993 Nov;16(11):1485-93.
- Cuthbertson DJ, Koskinen J, Brown E, Magnussen CG, Hutri-Kähönen N, Sabin M, et al. Fatty liver index predicts incident risk of prediabetes, type 2 diabetes and non-alcoholic fatty liver disease (NAFLD). Ann Med. 2021 Dec;53(1):1256-64.
- Kumar P, Rawat S, Kakar A, Sinha AK. Prevalence of non-alcoholic fatty liver disease among diabetes, prediabetes and healthy population. J Family Med Prim Care. 2022 Dec;11(12):7640-3.
- Dybjer E, Nilsson PM, Engström G, Helmer C, Nägga K. Pre-diabetes and diabetes are independently associated with adverse cognitive test results: a cross-sectional, population-based study. BMC Endocr Disord. 2018 Dec 4;18(1):91.
- Sumbul-Sekerci B, Sekerci A, Pasin O, Durmus E, Yuksel-Salduz ZI. Cognition and BDNF levels in prediabetes and diabetes: A mediation analysis of a cross-sectional study. Front Endocrinol (Lausanne). 2023;14:1120127.
- Cichosz SL, Jensen MH, Hejlesen O. Cognitive impairment in elderly people with prediabetes or diabetes: A cross-sectional study of the NHANES population. Prim Care Diabetes. 2020 Oct;14(5):455-9.
- Algvere P, Efendić S, Luft R, Wajngot A. Retinal microangiopathy and pigment epithelial lesions in subjects with normal, borderline, and decreased oral glucose tolerance. Br J Ophthalmol. 1985 Jun;69(6):416-9.
- Tapp RJ, Tikellis G, Wong TY, Harper CA, Zimmet PZ, Shaw JE, et al. Longitudinal association of glucose metabolism with retinopathy: results from the Australian Diabetes Obesity and Lifestyle (AusDiab) study. Diabetes Care. 2008 Jul;31(7):1349-54.
- Nguyen TT, Wang JJ, Wong TY. Retinal vascular changes in pre-diabetes and prehypertension: new findings and their research and clinical implications. Diabetes Care. 2007 Oct;30(10):2708-15.
- Wong TY, Klein R, Sharrett AR, Schmidt MI, Pankow JS, Couper DJ, et al. Retinal arteriolar narrowing and risk of diabetes mellitus in middle-aged persons. JAMA. 2002 May 15;287(19):2528-33.
- Nguyen TT, Wang JJ, Islam FMA, Mitchell P, Tapp RJ, Zimmet PZ, et al. Retinal arteriolar narrowing predicts incidence of diabetes: the Australian Diabetes, Obesity and Lifestyle (AusDiab) Study. Diabetes. 2008 Mar;57(3):536-9.
- Hoffman-Snyder C, Smith BE, Ross MA, Hernandez J, Bosch EP. Value of the oral glucose tolerance test in the evaluation of chronic idiopathic axonal polyneuropathy. Arch Neurol. 2006 Aug;63(8):1075-9.
- Smith AG, Singleton JR. The diagnostic yield of a standardized approach to idiopathic sensory-predominant neuropathy. Arch Intern Med. 2004 May 10;164(9):1021-5.
- Singleton JR, Smith AG, Bromberg MB. Increased prevalence of impaired glucose tolerance in patients with painful sensory neuropathy. Diabetes Care. 2001 Aug;24(8):1448-53.
- Nebuchennykh M, Løseth S, Jorde R, Mellgren SI. Idiopathic polyneuropathy and impaired glucose metabolism in a Norwegian patient series. Eur J Neurol. 2008 Aug;15(8):810-6.
- Smith AG, Ramachandran P, Tripp S, Singleton JR. Epidermal nerve innervation in impaired glucose tolerance and diabetes-associated neuropathy. Neurology. 2001 Nov 13;57(9):1701-4.
- Sumner CJ, Sheth S, Griffin JW, Cornblath DR, Polydefkis M. The spectrum of neuropathy in diabetes and impaired glucose tolerance. Neurology. 2003 Jan 14;60(1):108-11.
- Vistisen D, Kivimäki M, Perreault L, Hulman A, Witte DR, Brunner EJ, et al. Reversion from prediabetes to normoglycaemia and risk of cardiovascular disease and mortality: the Whitehall II cohort study. Diabetologia. 2019 Aug;62(8):1385-90.
- Kowall B, Rathmann W, Kuss O, Herder C, Roden M, Stang A, et al. Reversion from prediabetes to normoglycaemia after weight change in older persons: The KORA F4/FF4 study. Nutr Metab Cardiovasc Dis. 2021 Feb 8;31(2):429-38.
- Lindström J, Louheranta A, Mannelin M, Rastas M, Salminen V, Eriksson J, et al. The Finnish Diabetes Prevention Study (DPS): Lifestyle intervention and 3-year results on diet and physical activity. Diabetes Care. 2003 Dec;26(12):3230-6.
- Knowler WC, Barrett-Connor E, Fowler SE, Hamman RF, Lachin JM, Walker EA, et al. Reduction in the incidence of type 2 diabetes with lifestyle intervention or metformin. N Engl J Med. 2002 Feb 7;346(6):393-403.
- Lily M, Godwin M. Treating prediabetes with metformin: systematic review and meta-analysis. Can Fam Physician. 2009 Apr;55(4):363-9.
- DREAM (Diabetes REduction Assessment with ramipril and rosiglitazone Medication) Trial Investigators, Gerstein HC, Yusuf S, Bosch J, Pogue J, Sheridan P, et al. Effect of rosiglitazone on the frequency of diabetes in patients with impaired glucose tolerance or impaired fasting glucose: a randomised controlled trial. Lancet. 2006 Sep 23;368(9541):1096-105.
- Diabetes Prevention Program Research Group. Long-term effects of lifestyle intervention or metformin on diabetes development and microvascular complications over 15-year follow-up: the Diabetes Prevention Program Outcomes Study. Lancet Diabetes Endocrinol. 2015 Nov;3(11):866-75.
- Pan XR, Li GW, Hu YH, Wang JX, Yang WY, An ZX, et al. Effects of diet and exercise in preventing NIDDM in people with impaired glucose tolerance. The Da Qing IGT and Diabetes Study. Diabetes Care. 1997 Apr;20(4):537-44.
- Nathan DM, Buse JB, Davidson MB, Ferrannini E, Holman RR, Sherwin R, et al. Medical management of hyperglycaemia in type 2 diabetes mellitus: a consensus algorithm for the initiation and adjustment of therapy: a consensus statement from the American Diabetes Association and the European Association for the Study of Diabetes. Diabetologia. 2009 Jan;52(1):17-30.
- Ramachandran A, Snehalatha C, Mary S, Mukesh B, Bhaskar AD, Vijay V, et al. The Indian Diabetes Prevention Programme shows that lifestyle modification and metformin prevent type 2 diabetes in Asian Indian subjects with impaired glucose tolerance (IDPP-1). Diabetologia. 2006 Feb;49(2):289-97.
- Salpeter SR, Buckley NS, Kahn JA, Salpeter EE. Meta-analysis: metformin treatment in persons at risk for diabetes mellitus. Am J Med. 2008 Feb;121(2):149-157.e2.
- Unnikrishnan R, Shaw JE, Chan JCN, Wild SH, Peters AL, Orrange S, et al. Prediabetes. Nat Rev Dis Primers. 2025 Jul 17;11(1):49.
- Tse MTH, Chan VWK, Qiu J, Jin Y, Lai GZ, Wong MMH, et al. The efficacy of dietary interventions for prediabetes management: An umbrella review of meta-analyses. Pharmacol Res. 2025 Sep;219:107914.
102.Echouffo-Tcheugui JB, Perreault L, Ji L, Dagogo-Jack S. Diagnosis and Management of Prediabetes: A Review. JAMA. 2023 Apr 11;329(14):1206-16.
Correspondence
Geraldo Picheth
E-mail: [email protected]