Assessing the Agreement Between Calculated and Measured Arterial and Venous Oxygen Saturation in COVID-19 Patients
Avaliação da Concordância entre a Saturação de Oxigênio Calculada e Mensurada em Amostras Arteriais e Venosas de Pacientes com COVID-19
Daniel Ferreira Guilherme1, Carlos Eduardo da Silva Gonçalves2, Marlene de Freitas Madeira3, Ricardo Ambrosio Fock4
1,3 Hospital Universitário da Universidade de São Paulo, Brasil, Divisão de Laboratório Clínico, Departamento de Farmácia e Laboratório Clínico. São Paulo, SP, Brazil.
2,4 Faculdade de Ciências Farmacêuticas, Universidade de São Paulo, Brasil, Laboratório de Hematologia Experimental, Departamento de Análises Clínicas e Toxicológicas. São Paulo, SP, Brazil.
Received on 03/27/2025
Approved on 08/18/2025
DOI: 10.21877/2448-3877.202500228.en
INTRODUCTION
During the year 2020, the world was caught off-guard with the coronavirus disease 2019 (COVID-19) pandemic.(1) Despite numerous global efforts, the Severe Acute Respiratory Syndrome Coronavirus-2 (SARS-CoV-2) triggered a massive pandemic that resulted in millions of infections and deaths across different countries.(1) Naturally, the sudden escalation in infections with a then unknown virus posed many difficulties to public health.(2,3) These included the limited knowledge on how to treat COVID-19 cases, shortened staff availability due to ongoing infections, lack of cost-effective diagnostic markers for disease management, and more.(1,2) A significant portion of COVID-19 patients develop respiratory impairment due to acute respiratory distress syndrome (ARDS), which results in hypoxemia.(1)
Blood gas analysis is used to measure oxygen concentrations and evaluate disturbances in acid-base balance, blood oxygenation, and alveolar ventilation. It is also a key step in diagnosis that allows the assessment of both respiratory and metabolic conditions, making it one of the most common methods used in emergency and critical care settings.(4)
Blood gas analyses measure the hydrogen potential (pH), thus determining the degree of acidity, neutrality, or alkalinity of the blood.(4,5) The partial pressure of carbon dioxide (pCO₂) reflects the effectiveness of alveolar ventilation, while the partial pressure of oxygen (pO₂) indicates the efficiency of oxygen exchange between the pulmonary alveoli and capillaries.(4,5) Bicarbonate ions (HCO₃-) are involved in the blood’s buffering system, helping to maintain acid-base homeostasis.(4,5) Oxyhemoglobin saturation (SpO₂) measures the percentage of hemoglobin in the blood that is bound to oxygen.(4,5)
SpO₂ is a key indicator of how effectively oxygen is being transported to tissues and organs.(6,7) This information is essential for evaluating respiratory and cardiovascular function, diagnosing conditions, and guiding treatment decisions.(6,7) However, there is a difference in the technologies used to determine SpO₂. It can be estimated mathematically from pO₂ and the oxygen dissociation curve, or measured directly using photometric technology, which offers real-time and accurate data.(8,9)
In this context, recognizing that precise monitoring of O₂ in patients with COVID-19 is essential for adequate intervention, and acknowledging that two different methods exist—calculated versus measured—to determine SpO₂, this study compares both methods to evaluate their applicability in COVID-19 monitoring, an area that remains unexplored. With this in mind, we describe the comparison between calculated and measured arterial and venous oxygen saturation.
MATERIAL AND METHODS
This study included men and women over 18 years of age with COVID-19 symptoms who were admitted to the emergency department and ICU of a secondary hospital between June 2020 and April 2021. Since the COVID-19 vaccination process began in January 2021, most samples represent the first wave of the pandemic. Patients were confirmed to be COVID-19 positive by RT-PCR. Samples were selected based on patient consent, and the study was approved by the Ethics and Research Committee of the Hospital Universitário da Universidade de São Paulo, adhering to the Helsinki Declaration (CAAE: 47667421.6.0000.0076).
Our study included patients infected with COVID-19, all of whom had both arterial and venous blood samples collected. Patients, whether or not they had hypoxemia, were included in the study. The exclusion criteria were individuals under the age of 18, blood samples collected from vessels other than arteries or veins. Each patient had both arterial and venous samples measured simultaneously using an automated blood gas analyzer (GEM Premier™ 4000, Werfen, Spain). The calculated SpO2 was obtained by the instrument when the specific electrode for this measurement was disabled. Subsequently, after enabling the electrode, SpO2 was also directly measured.
For venous oxygen monitoring, the 51 samples were analyzed, with values ranging from 45% to 96%. For arterial oxygen monitoring, 35 samples were analyzed, with values ranging from 83% to 100%. Raw data were tabulated, and correlations between calculated and measured samples were analyzed using the ‘Two-Instrument Comparison’ module of EP Evaluator software (Data Innovations, USA), yielding the correlation coefficient, standard error estimate, and error index. This module applies a straightforward approach to compare two methods without using linear regression. Methods X and Y are considered equivalent within the allowable error if, for each specimen, the difference between the two does not exceed the total allowable error.
Both arterial and venous data were subjected to a total allowable error of 10%, established based on the historical coefficient of variation of the analytical system’s performance (GEM Premier™ 4000, Werfen, Spain), calculated from the longitudinal variation of laboratory results over time.
Additionally, student’s t-test was used to compare calculated and measured samples. Statistical significance was set at p ≤ 0.05 (95% confidence level). Analyses were performed using GraphPad Prism® (GraphPad Software Inc., USA).
RESULTS AND DISCUSSION
When comparing the measured versus calculated venous oxygen saturation, the results showed an average error index of -0,06, ranging from -0,63 to 0,77. The correlation coefficient (R) was 0,9840, with a standard error estimate of 2,4 in the venous samples. Regarding the arterial comparisons, our analysis revealed an average error index of -0.06, ranging from -0.41 to 0.21. Arterial samples also showed a strong correlation, with an R of 0.9291 and an estimated standard error of 1.5. Thus, no statistical difference was observed between the measured and calculated sample results (Figure 1).
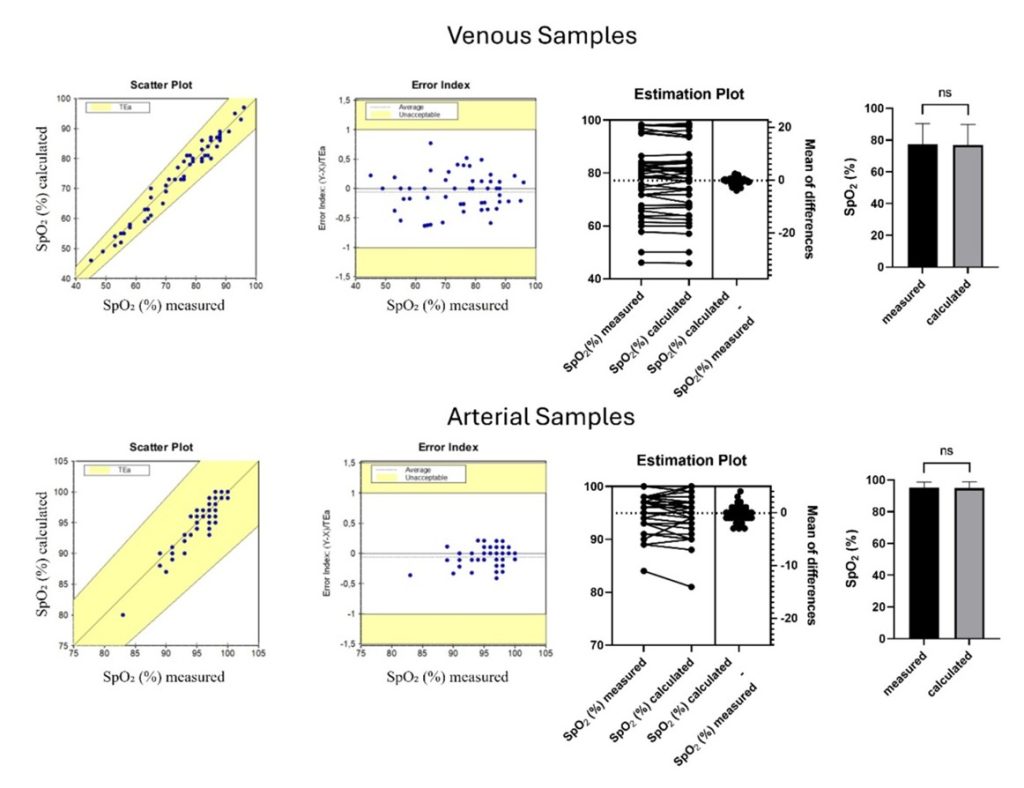
Figure 1
Agreement between calculated and measured oxygen saturation in arterial and venous samples.
Subtitle: Scatter plots, error indices, estimation plots, and results expressed as mean ± SD for measured and calculated SpO₂ are presented. As shown in the graphs, both venous and arterial blood samples demonstrated a strong correlation in the SpO₂ parameter, whether calculated or measured, with no statistically significant difference between the two methods.
Depending on the blood gas analyzer used, SpO₂ is either measured directly using photometric technology or calculated from the measured pO₂.(8) Several studies in the literature show that it is preferable to measure SpO₂ rather than calculate it.(6,9,10) However, only modern blood gas analyzers incorporate the technology required for direct measurement of SpO₂. These analyzers are more precise and accurate but come with higher costs compared to equipment that calculates SpO₂.(6,9)
Before the development of blood gas analyzers with integrated photometric technology, SpO₂ could only be determined by calculation from the measured pO₂ during blood gas analysis. Even today, many blood gas analyzers in use lack photometric technology, with calculated SpO₂ values remaining common in clinical practice.(5,6,8)
Considering this, and especially knowing that these advanced technologies are still not widely available in many healthcare settings — particularly in underserved areas or in the poorest countries — this study aimed to compare both technologies and evaluate their reproducibility in assessing SpO₂ in patients positive for COVID-19.
Before discussing our results, it is important to note that equipment that measures SpO₂ uses light absorption at specific wavelengths to provide precise measurements of hemoglobin derivatives, such as oxyhemoglobin (HbO₂), deoxyhemoglobin, carboxyhemoglobin (HbCO), and methemoglobin (MetHb). These parameters are not measured by equipment that calculates SpO₂.(11,12)
This is especially relevant because, in healthy individuals, HbCO and MetHb combined account for less than 5% of the total hemoglobin. Consequently, the total hemoglobin concentration primarily reflects oxyhemoglobin and deoxyhemoglobin levels.(11,12) However, certain pathologies, such as carbon monoxide poisoning and methemoglobinemia, are characterized by a substantial rise in HbCO or MetHb levels, which significantly impairs the blood’s ability to carry oxygen. By analyzing light absorption at multiple specific wavelengths in a hemolyzed sample, it is possible to accurately measure the concentrations of all four hemoglobin species.(11)
On the other hand, equipment that calculates SpO₂ does not measure these hemoglobin derivatives directly. Instead, SpO₂ is estimated using mathematical formulas that rely on the measured pO₂ and its relationship with the oxygen dissociation curve under standard conditions (pH 7.4, pCO₂ 40 mmHg, 2,3-diphosphoglycerate concentration, and temperature of 37°C). Therefore, it is evident that an increased proportion of dyshemoglobins (HbCO and MetHb) or deviations from standard conditions can significantly impact the accuracy of calculated SpO₂ values.(6,8,10)
Although calculated methods provide sufficiently accurate SpO₂ estimations for most patients, it is important to note that individuals with severe acid-base disturbances, significant changes in body temperature (hypothermia or hyperthermia), abnormal 2,3-DPG levels, or a marked increase in dyshemoglobins may yield inaccurate SpO₂ results.(4,6,12,13)
Returning to our findings, we observed no differences between calculated and measured SpO₂ in COVID-19 patients. However, it is essential to emphasize that, while a correlation was observed between the two methods in our results, we cannot assume that similar correlations would hold in COVID-19 patients with dyshemoglobinemia or other factors that alter the oxygen dissociation curve. This highlights a limitation of our study, as variations in these parameters or the presence of dyshemoglobins in our patients were not evaluated.
Thus, our results suggest that both methods of SpO₂ monitoring can be used effectively in clinical practice. However, it is important to note that in cases of moderate hypoxia, with rapid clinical deterioration and under mechanical ventilatory support, the measured SpO₂ provides better support, more accurately reflects, and more reliably guides both diagnosis and clinical management. This has significant relevance for primary clinical outcome.(4,6,7) This finding is particularly relevant for healthcare providers in resource-limited settings where access to advanced diagnostic tools is restricted. Consequently, implementing cost-effective oxygen saturation monitoring methods may aid in the management of COVID-19, especially in underdeveloped contexts.
CONCLUSION
In conclusion, our findings demonstrate a strong correlation and minimal error between measured and calculated SpO₂ values in both venous and arterial samples from COVID-19 patients, suggesting that either method can be effectively used in clinical practice under standard physiological conditions. However, while calculated SpO₂ offers a cost-effective alternative—especially valuable in resource-limited settings—it may be less accurate in patients with dyshemoglobinemia, acid-base imbalances, or altered oxygen dissociation curves. Therefore, in critically ill patients or those requiring precise oxygenation monitoring, direct measurement remains the more reliable option for guiding clinical decisions and improving outcomes.
REFERENCES
- Lamers MM, Haagmans BL. SARS-CoV-2 pathogenesis. Nat Rev Microbiol 2022;20:270-84. doi:10.1038/s41579-022-00713-0.
- Smereka J, Szarpak L. COVID 19 a challenge for emergency medicine and every health care professional. The American Journal of Emergency Medicine 2020;38:2232-3. doi:10.1016/j.ajem.2020.03.038.
- Sorbello M, Greif R. COVID-19 pandemic: A multifaceted challenge for science and healthcare. Trends in Anaesthesia and Critical Care 2020;34:1-3. doi:10.1016/j.tacc.2020.08.009
- Korpi-Steiner N, Horowitz G, Tesfazghi M, Suh-Lailam BB. Current Issues in Blood Gas Analysis. J Appl Lab Med. 2023 Mar 6;8(2):372-381. doi: 10.1093/jalm/jfac080.
- Yee J, Frinak S, Mohiuddin N, Uduman J. Fundamentals of Arterial Blood Gas Interpretation. Kidney 360. 2022 Jun 3;3(8):1458-1466. doi: 10.34067/KID.0008102021.
- Johnson P, Bihari D, Raper R et al. A comparison between direct and calculated oxygen saturation in intensive care. Anaesth Intensive Care 1993; 21: 72-75.
- Carvalho EB, Leite TRS, Sacramento RFM, Nascimento PRLD, Samary CDS, Rocco PRM, Silva PL. Rationale and limitations of the SpO2/FiO2 as a possible substitute for PaO2/FiO2 in different preclinical and clinical scenarios. Rev Bras Ter Intensiva. 2022 Jan-Mar;34(1):185-196. doi: 10.5935/0103-507X.20220013-pt.
- Breuer HW, Groeben H, Breuer J, Worth H. Oxygen saturation calculation procedures: a critical analysis of six equations for the determination of oxygen saturation. Intensive Care Medicine 1989; 15: 385-89.
- Mybergh J. Derived oxygen saturations are not clinically useful for the calculation of oxygen consumption. Anaesth Intensive Care 1992; 20: 460-463.
- Woda R, Dzwonczyk R, Orlowski J et al. Effect of measurement error on calculated variables of oxygen transport. J Applied Physiol 1996; 80: 559-63.
- Hess D, Elser R, Agarwal N. The effects on the pulmonary shunt value of using measured versus calculated saturation and of correcting for the presence of carboxyhemoglobin and methemoglobin. Respiratory Care 1984; 29: 1001-05.
- Gothgen I, Siggard-Anderson O, Kokholm G. Variations in the hemoglobin dissociation curve in 10079 arterial blood samples. Scand J Clin Lab Invest 1990; 50, 203: 87-90.
- Morgan T. The oxyhaemoglobin dissociation curve in critical illness. Critical Care and Resuscitation 1999; 1: 93-100.
Correspondence
Ricardo Ambrosio Fock
E-mail: [email protected]