
Performance evaluation of the Abbott Alinity hq hematology analyzer for cerebrospinal fluid and other body fluids analysis: A critical assessment
Avaliação de desempenho do analisador hematológico Abbott Alinity hq para análise do líquido cefalorraquidiano e outros fluidos corporais: uma análise crítica
Samuel Ricardo Comar1, Larissa Aparecida Vieira1, Luis Rodrigues de Sena Neto1, Salomão Cury Riechi1, Angela Maria de Souza Fronza1, Karyna Leal Antonio1, Nágila Taline Brotto1, Marcio Augusto Batista1, Giuliane Barros de Melo Leal1, Gisele Maria Buczenko Singer1
1 Universidade Federal do Paraná, Laboratório de Hematologia do Complexo Hospital de Clínicas. Curitiba, PR, Brazil.
Received on 05/17/2025
Approved on 06/29/2025
DOI: 10.21877/2448-3877.202500242.en
INTRODUCTION
The analysis of body fluids (BF) has substantial diagnostic value, guiding therapy and monitoring various pathologies such as neoplasms, hemorrhages, inflammatory processes, and infectious diseases. Due to its importance, it should ideally have high precision and accuracy to avoid underestimating or overestimating the diagnosis of treatable diseases. Traditionally, BF analysis is performed using manual optical microscopy (MOM) as the gold standard, combining total cell counting in a hemocytometer with differential counting on slides prepared by cytocentrifugation and stained with appropriate dyes. The accuracy of manual counting depends on variables such as the correct sample volume loaded into the hemocytometer, proper dilution preparation, the number of quadrants and cells counted, and the adequate preparation of slides by cytocentrifugation. Despite these considerations, manual methods still exhibit significant inaccuracy and imprecision in low-cellularity samples. They are also labor-intensive, time-consuming, require highly experienced laboratory personnel, and present considerable intra- and inter-operator variability. On the other hand, automated body fluid analysis has advanced significantly in recent years, often improving accuracy, precision, efficiency, and laboratory productivity while reducing costs and turnaround time, despite challenges related to low cellularity and sample matrix effects.(1-7)
Among these systems, the Abbott Alinity hq uses optical principles and fluorescence for cell differentiation, and has been widely validated for peripheral blood counts.(8-11) However, the use of its whole blood channel for automated BF analysis still lacks standardization and formal recognition, especially in the absence of a specific BF mode like other modern hematology analyzers.(7,13,14)
Despite the existence of extensive literature validating the use of other hematology analyzers with specific channels for BF, it is imperative that each new technology introduced into laboratory practice be rigorously validated for this application. The physical and morphological characteristics of biological fluids vary significantly, and the performance of automated systems can be affected by factors such as low cellularity, viscosity, and the presence of debris. Validating new systems for automated BF counts, even in the absence of dedicated channels, is essential not only to ensure diagnostic safety, but also to support the advancement and evolution of future generations of analyzers.(14,15)
The generation of independent evidence and the documentation of limitations and potential contributions are indispensable steps for the consolidation of any new technological platform in the laboratory routine. From this perspective, the present study aimed to comparatively evaluate the performance of Alinity hq hematology analyzer in the total and differential counting of nucleated cells in BF, using the conventional whole blood channel for automated cell counts, in relation to the manual reference method.
MATERIAL AND METHODS
Alinity hq hematology analyzer and the technology employed for body fluid analysis
The Abbott Alinity hq hematology analyzer (Abbott Laboratories, Diagnostics Division, Hematology, Santa Clara, CA, USA) was launched in mid-2017 and obtained CE marking certification, while FDA approval was granted in 2023. Nevertheless, the Alinity hq does not yet have a dedicated module for BF analysis. The Alinity hq employs the advanced Multi-Angle Polarized Scatter Separation (MAPSS advanced) technology (Figure 1) for cell quantification and differentiation, offering a promising approach to automated BF analysis through its whole blood analysis channel.
Specifically, the Alinity hq utilizes light scatter signals to aid in cell identification: Axial Light Loss (ALL) to determine cell size; four types of Intermediate-Angle Scatter (IAS, IAS1, IAS2, and IAS3) to measure cellular complexity; Polarized Side-Scatter (PSS) to assess nuclear lobularity in white blood cells; Depolarized Side-Scatter (DSS) to differentiate neutrophil from eosinophil granularity (the latter depolarizes light during scatter analysis); and fluorescence-based detection (FL1), in which a proprietary reagent containing a nuclear fluorescent dye stains nuclei and certain cytoplasmic nucleic acids, facilitating WBC differential counting and cellular activation measurement.(11,12)
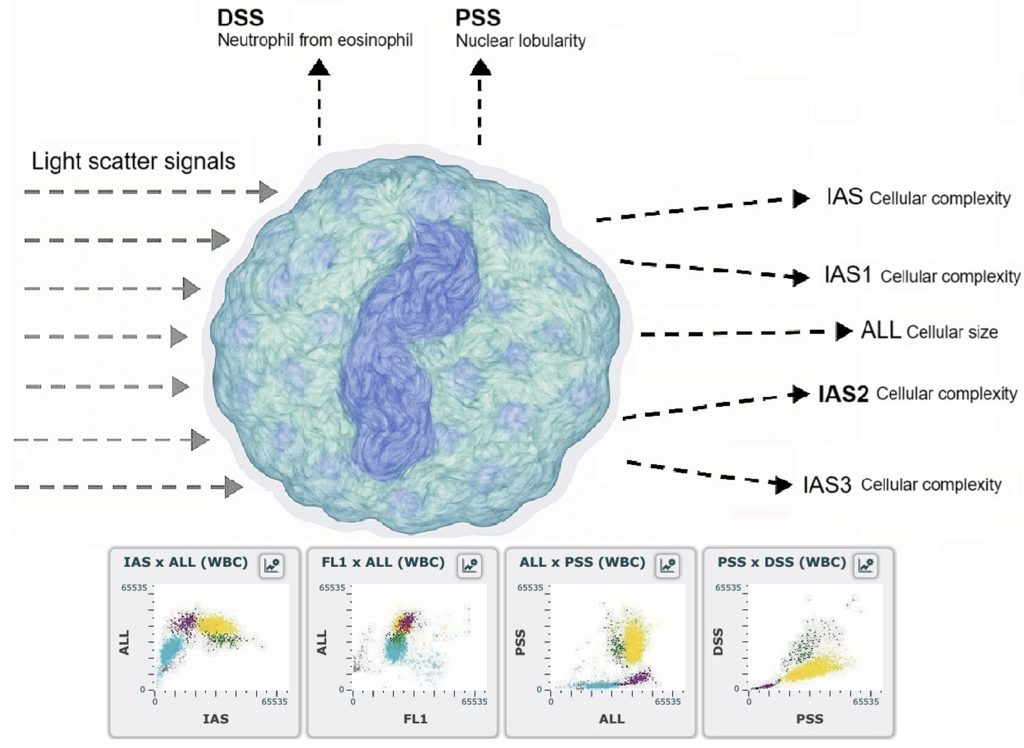
Figure 1
Optical flow cytometry Multi-Angle Polarized Scatter Separation (MAPSS advanced).
Legend: ALL: axial light loss; IAS: intermediate-angle scatter; PSS: polarized side-scatter; DSS: depolarized side-scatter and FL1: fluorescence-based detection.
Study design
This study was conducted at the Hematology Laboratory of the Complexo Hospital de Clínicas da Universidade Federal do Paraná (CHC-UFPR). A total of 102 serous fluids (SF) (69 peritoneal, 30 pleural, and 3 pericardial), 100 cerebrospinal fluids (CSF), and 50 bronchoalveolar lavages (BAL) were analyzed from a diverse population of hospitalized and outpatient individuals (158 men; 94 women; ages 0–86 years). All SF samples were collected in tubes containing anticoagulant (heparin), while CSF and BAL samples were collected in anticoagulant-free tubes and analyzed within 2 hours of collection. All samples met the local criteria for sample acceptance. Laboratory analysis included automated total and differential WBC counts. All BF were analyzed in open mode, requiring 84µL of sample volume. Manual nucleated cell counts were performed using a Neubauer improved bright-line chamber for SF and BAL and a Fuchs-Rosenthal chamber for CSF, followed by cytocentrifugation, natural air drying, and Wright-Giemsa staining on the Alinity hq automated slide maker and stainer. Manual differential counts were determined by counting between 100 and 400 cells at 1000× magnification under oil immersion by two experienced observers, with a third observer involved in case of discrepancies.
We assessed precision, analytical sensitivity, linearity, carryover, and correlation according to the Clinical and Laboratory Standards Institute (CLSI) H26-A2 and H56-A guidelines. To assess within-run precision of the Alinity hq, analyses were performed under normal conditions by the same operator, at the same time of day, using the same reagent batches. Precision was determined by analyzing 10 replicates of 4 serous fluid samples and 4 CSF samples at different cell concentration levels, including medical decision points (0–11600 nucleated cells/µL).
Analytical sensitivity, or the lower limit of quantification (LLoQ), was defined as the cell concentration at which the coefficient of variation (CV) reached 20%.(16-18) Linearity, or the analytical measurement range, was established by performing serial dilutions of BF samples with the analyzer’s diluent to cover the full operational range of the instrument. To determine carryover, two BF samples – one with a high cell count and one with a low cell count -were selected. The high-cellularity sample was analyzed in triplicate (H1, H2, H3), immediately followed by triplicate analysis of the low-cellularity sample (L1, L2, L3). Carryover was calculated using Broughton’s formula: carryover % = (L1 – L3) × 100 / (H1 – L3).(19)
For the comparison between manual and automated differential cell counts, cells were categorized into two groups: a) polymorphonuclear (PMN) cells (neutrophils, eosinophils, and basophils) and b) mononuclear (MN) cells (lymphocytes, monocytes, macrophages, mesothelial cells, plasma cells, and neoplastic cells). Internal and external quality control procedures were followed to monitor performance and ensure the proper functioning of the Alinity hq, thereby guaranteeing the reliability of the reported results.
The performance attributes of the Alinity hq hematology analyzer for BF analysis were primarily assessed in the setting where the instrument was installed, by the personnel operating the analyzer, and considering the patient population served by the authors’ laboratory. Measures of diagnostic accuracy and agreement between automated and manual cell counts obtained by optical microscopy was evaluated on MedCalc version 7.3.0.1 (MedCalc Software, Mariakerke, Belgium), with p-values <0.05 considered statistically significant. Nonparametric statistical methods were employed due to the non-normal data distribution.
RESULTS
Table 1 summarizes the precision of the Alinity hq for WBC, MN, and PMN counts in CSF and SF. The coefficient of variation was ≤10% for most concentration ranges but exceeded 20% in very low-cellularity samples.
The Alinity hq demonstrated excellent linearity across all tested ranges, with R² values >0.98 for SF and CSF (Table 2). Slopes close to 1 and minimal intercepts confirmed proportional and unbiased results.
An important aspect observed in this study was the necessity of performing at least two background washes to minimize carryover between consecutive samples. Initially, WBC carryover was detected at unacceptable levels (4.93%), but after implementing multiple washes, values were reduced to less than 1%, a clinically insignificant result. This finding highlights the importance of optimizing operational protocols to ensure result integrity in sequential analyses, minimizing sample-to-sample contamination, particularly in high-volume and complex sample environments. However, it also underscores the need for adequate laboratory staff training to ensure adherence to recommended protocols.
Table 3 presents the correlation between automated and manual counts. For SF, Spearman correlation coefficients were strong for WBCs (r=0.881) and PMN (r=0.775) but moderate for MN (r=0.733). In CSF, WBC correlation was good, whereas automated PMN and MN counts tended to underestimate manual counts. In BAL, correlations were weaker, especially for WBCs (r=0.298), suggesting that the Alinity hq may face challenges in analyzing this fluid type, possibly due to its unique matrix properties.
Table 1
Precision expressed as coefficient of variation (CV) of the Alinity hq white blood cell (WBC), mononuclear cell (MN) and polymorphonuclear cell (PMN) counts in cerebrospinal fluid and cavity fluids.
| Cerebrospinal FLUID | |||||
| WBC/µL | CV % | MN/µL | CV% | PMN/µL | CV % |
| < 5 | 316.22 | < 5 | 210.82 | < 5 | 310.45 |
| 5 – 50 | 33.14 | 5 – 50 | 22.15 | 5 – 50 | 11.19 |
| 50 – 500 | 5.34 | 50 – 500 | 15.43 | 50 – 500 | 8.37 |
| 500 – 1000 | 4.23 | 500 – 1000 | 8.29 | 500 – 1000 | 6.53 |
| CAVITY FLUIDS | |||||
| WBC/µL | CV % | MN/µL | CV% | PMN/µL | CV % |
| 0 – 300 | 28.85 | 0 – 300 | 39.39 | 0 – 300 | 33.34 |
| 300 – 500 | 7.43 | 300 – 500 | 9.93 | 300 – 500 | 6.29 |
| 1000 – 6000 | 5.83 | 1000 – 6000 | 6.75 | 1000 – 6000 | 5.92 |
| 6000 – 10000 | 5.02 | 6000 – 10000 | 6.02 | 6000 – 10000 | 5.07 |
Table 2
Linearity of the Alinity hq for white blood cells (WBC), mononuclear cells (MN) and polymorphonuclear cells (PMN) counts in cavity fluids and cerebrospinal fluid.
| CAVITY FLUIDS | CEREBROSPINAL FLUID | ||||||
| WBC | MN | PMN | WBC | MN | PMN | ||
| R2 | 0.999* | 0.989* | 0.999* | R2 | 0.999* | 0.986* | 0.999* |
| slope | 0.988 | 0,981 | 0.989 | slope | 1.05 | 1.75 | 0.99 |
| Intercept | -84.1 | -11.74 | -72.3 | intercept | -100.16 | -31.94 | -68.64 |
*p<0.001
Table 3
Spearman’s correlation, Passing–Bablok Regression, Bland–Altman Bias and Mann-Whitney U-test for different parameters in Alinity hq vs Optical Microscopy in cavity fluids, cerebrospinal fluid, and bronchoalveolar lavage.
| CAVITY FLUIDS | |||||||||||
| Parameter | N | Mean | Median | Range | Spearman’s correlation (p-value) | Passing–Bablok Regression
(95% CI intercept; slope) |
Bland-Altman Bias
(95% CI) |
Mann-Whitney
(p-value) |
|||
| OM | Alinity hq | OM | Alinity hq | OM | Alinity hq | ||||||
| WBC/µl OM x Alinity hq | 102 | 1361.7 | 1521.0 | 150.0 | 247 | 50 – 23200 | 9 – 27300 | 0.881 | y=13.20+0.86x
(5.03 to 21.74; 0.84 to 0.91) |
-159.3
(-283.0 to -35.6) |
0.58 |
| MN (%) OM x Alinity hq | 100 | 77.4 | 69.6 | 89.0 | 78.4 | 2 – 100 | 1 – 99 | 0.733 | y=16.58+0.87x
(6.00 to 33.66; 0.66 to 1.00) |
7.89
(4.83 to 10.96) |
<0.001 |
| PMN (%) OM x Alinity hq | 100 | 22.8 | 29.7 | 8.0 | 20.6 | 1 – 95 | 0 – 99 | 0.775 | y=-4.74+0.93x
(-6.20 to -2.00; 0.80 to 1.01) |
-6.93
(-9.32 to 4.54) |
0.001 |
| CEREBROSPINAL FLUID | |||||||||||
| Parameter | N | Mean | Median | Range | Spearman’s correlation
(p-value) |
Passing–Bablok Regression
(95% CI intercept; slope) |
Bland-Altman Bias
(95% CI) |
Mann-Whitney
(p-value) |
|||
| OM | Alinity hq | OM | Alinity hq | OM | Alinity hq | ||||||
| WBC/µl OM x Alinity hq | 100 | 96.9 | 103.3 | 22.9 | 9.0 | 0.6 – 1035 | 0 – 1100 | 0.861 | y=-046+0.86x
(-1.12 to 0.95; 0.84 to 0.90) |
-6.23
(-13.27 to 0.83) |
0.92 |
| MN (%) OM x Alinity hq | 97 | 78.2 | 77.6 | 99.0 | 98.2 | 0 – 100 | 0 – 100 | 0.462 | y=1.00x
(0.98 to 1.02) |
0.49
(-1.46 to 2.45) |
0.52 |
| PMN (%) OM x Alinity hq | 97 | 7.6 | 10.4 | 0 | 0 | 0 – 100 | 0 – 100 | 0.530 | y=0.35x
(0.10 to 0.65) |
-2.63
(-4.44 to -0.97) |
0.07 |
| BRONCHOALVEOLAR LAVAGE | |||||||||||
| Parameter | N | Mean | Median | Range | Spearman’s correlation
(p-value) |
Passing–Bablok Regression
(95% CI intercept; slope) |
Bland-Altman Bias
(95% CI) |
Mann-Whitney
(p-value) |
|||
| OM | Alinity hq | OM | Alinity hq | OM | Alinity hq | ||||||
| WBC/µl OM x Alinity hq | 50 | 2736.0 | 738.3 | 75.0 | 234 | 50 – 39400 | 0 – 6730 | 0.298 | y=15.31+0.46x
(-341.50 to 13.11; 0.37 to 1.88) |
-6.23
(-13.27 to 0.83) |
0.92 |
| MN (%) OM x Alinity hq | 50 | 61.3 | 42.4 | 79.5 | 45.3 | 11 – 100 | 0 – 100 | 0.670 | y=12.74+1.06x
(-0.42 to 20.83; 0.86 to 1.31) |
0.49
(-1.46 to 2.45) |
0.52 |
| PMN (%) OM x Alinity hq | 50 | 39.3 | 51.2 | 20.5 | 51.4 | 0 – 92 | 0 – 91.6 | 0.485 | y=-16.83+1.16x
(-56.33 to -5.31; 0.82 to 1.66) |
-2.63
(-4.44 to -0.97) |
0.07 |
WBC – white blood cell; MN – mononuclear cells; PMN – polymorphonuclear cells; CI – confidence interval; OM – optical microscopy.
DISCUSSION
Biological fluids possess a distinct matrix and cellular composition compared to whole blood. Therefore, generating evidence that an analyzer is capable of delivering accurate and reproducible results for these specimens constitutes a fundamental aspect of good laboratory practice.(18) The Alinity hq exhibits excellent precision in samples with moderate to high cell concentrations, with coefficients of variation (CV) below 10% across most evaluated ranges. However, in low-cellularity samples (<5 cells/µL), precision was compromised, with CVs exceeding 20%.
This finding is consistent with challenges observed in other automated systems, where low cell density increases measurement variability. The analytical sensitivity, defined as the lower limit of quantification (LLoQ), was established at approximately 5 cells/µL, a threshold in line with modern hematology analyzer expectations. These results highlight the need for caution when interpreting low-cellularity samples, suggesting supplementation with manual methods when necessary. Minimal carryover (<1%) was achieved only after implementing at least two background washes, emphasizing the importance of strict adherence to washing protocols. The aqueous matrix of CSF and BAL posed challenges, leading to underestimation of PMN counts.
Similar findings have been reported in studies evaluating other analyzers, reinforcing the necessity for matrix-specific algorithms. The absence of a dedicated BF mode in the Alinity hq limits its performance compared to analyzers such as the Sysmex XN-Series and Mindray BC-Series, which incorporates specialized channels for BF. A dedicated mode could enhance both accuracy and operational efficiency, addressing current limitations. Our findings align with previous studies demonstrating strong correlations between automated and manual methods for total WBC counts, but only poor to moderate correlations for MN and PMN differentiation. The underestimation of PMN in CSF is consistent with reports on analyzers utilizing light scattering principles.(7,20-24)
Another critical challenge in automated BF analysis is matrix interference. Different fluid types exhibit distinct physical and chemical properties, directly influencing analyzer performance. For example, CSF and BAL have a more aqueous and less complex matrix compared to cavity fluids. These compositional differences can lead to under- or overestimation of cell counts, depending on the analyzer’s ability to adapt to the specific matrix. In the case of the Alinity hq, we observed more pronounced discrepancies in the differential counts of MN and PMN in CSF and BAL. This may be attributed to their more diluted matrix, which could impair the MAPSS advanced system’s ability to accurately detect cells. These findings underscore the need for developing matrix-specific algorithms tailored to different fluid types to ensure optimal analytical performance.
The comparison between Alinity hq automated counts and manual counts revealed strong correlations but also notable discrepancies. The total WBC count in cavity fluids demonstrated a high correlation between Alinity hq and MOM (Spearman=0.881), suggesting that automation is reliable for estimating overall cellularity. However, Bland-Altman analysis identified a mean bias of -159.3 WBC/µL, indicating a slight underestimation by the Alinity hq. This limitation is particularly relevant in low-cellularity samples, where minor variations may significantly impact clinical interpretation.
Passing-Bablok regression for WBC yielded the equation y=13.20+0.86x, indicating a slight proportional bias with a tendency to underestimate higher values. The positive intercept (13.20) suggests a small constant bias, meaning that even when MOM reports low WBC counts, the Alinity hq may still yield slightly elevated values. This discrepancy is expected due to methodological differences in cell quantification, as MOM relies on direct hemocytometer counting, while the Alinity hq employs optical and fluorescence-based differentiation. For differential counting, MN exhibited a moderate correlation with MOM (Spearman=0.733). Passing-Bablok regression produced the equation y=16.58+0.87x, with a Bland-Altman mean bias of 7.89%, indicating a tendency for the Alinity hq to overestimate MN fractions, particularly in low-cellularity samples. On the other hand, PMN showed a slightly stronger correlation (Spearman=0.775), with Passing-Bablok regression yielding y=-4.74+0.93x, suggesting a mild underestimation bias.
Bland-Altman analysis revealed a mean bias of -6.93%, indicating that the Alinity hq may have reduced sensitivity for detecting subtle increases in the PMN fraction – an important consideration in identifying infectious processes. The statistical significance of these findings was confirmed through Mann-Whitney tests, which yielded p<0.001 for MN and p=0.001 for PMN, indicating that the observed differences between methods are unlikely to be due to chance and instead reflect systematic variations in cell classification. Previous studies have also observed that Alinity hq may exhibit differences compared to manual counts, especially in samples with low cell counts, which may affect diagnostic accuracy in critical clinical settings.(21)
The results for CSF followed a pattern similar to that observed in cavity fluids. The total WBC count exhibited a strong correlation between methods (Spearman=0.861); however, the mean bias of -6.23 WBC/µL suggests a slight underestimation by the Alinity hq. The Passing-Bablok equation y=-0.46+0.86x confirms this trend, indicating a linear relationship between methods with a minor tendency to underestimate higher values. The differential count showed a low correlation for MN (Spearman=0.462), with a Passing-Bablok slope coefficient of 1.00, suggesting a proportional relationship between methods without significant bias. For PMN, the correlation was slightly higher (Spearman=0.530), but the equation y=0.35x indicates a significant underestimation of PMN counts by the Alinity hq, further supported by the Bland-Altman bias of -2.63%. This limitation is particularly relevant for bacterial meningitis diagnosis, where precise detection of PMN can be critical for therapeutic decision-making. The Mann-Whitney p-value for PMN was 0.07, suggesting that the difference between methods may not be statistically significant for this cell fraction, whereas for MN, it was 0.52, underscoring the need for cautious interpretation. These findings are consistent with studies highlighting the importance of accurate CSF PMN counts for accurate diagnoses of infectious conditions.(21)
In comparison with the Fuchs–Rosenthal chamber, the Alinity hq demonstrated superior performance in detecting pathological cell counts in cerebrospinal fluid (CSF). Specifically for pathological cell counts defined as ≥6 nucleated cells/μL CSF, the Alinity hq achieved sensitivity, specificity, and accuracy rates of 91.5%, 93.9%, and 92%, respectively. For higher pathological cell counts (≥20 nucleated cells/μL CSF), the corresponding sensitivity, specificity, and accuracy rates were 92.6%, 94.3%, and 93%, respectively. When comparing non-pathological total cell counts between 0 and 5 cells/μL, the Alinity hq method exhibited a mean difference of 0.7 cells higher than the manual chamber method. For total cell counts ranging from 0 to 200 cells/μL, the Alinity hq method showed a mean difference of 4.7 cells higher than the manual chamber method. These findings are overall in accordance with the results of other hematology analyzers that also reported more frequent pathologic cell counts as compared to manual cell counting.(12)
Among the three categories evaluated, BAL exhibited the greatest discrepancies. The total WBC count showed a weak correlation (Spearman=0.298), and the Passing-Bablok equation y=15.31+0.46x indicated considerable variability between methods, raising concerns about the reliability of the Alinity hq for this sample type. The Bland-Altman mean bias of -6.23 WBC/µL suggests a significant underestimation, which may affect the evaluation of pulmonary inflammatory processes. The differential count demonstrated a moderate correlation for MN (Spearman=0.670) and PMN (Spearman=0.485). The Passing-Bablok model for MN (y=12.74+1.06x) indicated a tendency toward overestimation, while for PMN the equation y=-16.83+1.16x revealed substantial bias, further highlighting the imprecision of the Alinity hq in distinguishing cell populations in BAL samples.
This study presents some limitations that should be considered when interpreting the results. First, BF samples containing neoplastic cells were not included and the identification of this kind of cells in BF has significant clinical relevance. However, detailed cytomorphological analysis was not within the scope of this study, which focused exclusively on comparing total and differential leukocyte counts between the Alinity hq analyzer and the manual counting method. In addition, the absence of a dedicated BF mode in the Alinity hq represents an inherent technical limitation, particularly in samples with low cellularity or atypical physicochemical characteristics.
Although the procedures strictly followed the recommended dilution and washing protocols, we acknowledge that analyzer performance may be affected by these variables – especially in fluids like BAL and CSF, which showed greater variability in results. Lastly, as a single-center study, the results may reflect operational and population-specific characteristics of the institution in which it was conducted, reinforcing the need for multicenter validations before the broad implementation of the evaluated technology for this application.
In conclusion, the Abbott Alinity hq demonstrated good performance in estimating total nucleated cell counts in SF and CSF, with results comparable to the manual method, even without a specific mode for BF. However, differential analysis, especially in BAL and in samples with low cellularity, remains limited. Also demonstrated a good precision, linearity, and minimal carryover across a broad range of cellular concentrations provided that appropriate washing protocols are strictly followed. However, the discrepancies observed in low-cellularity samples and aqueous matrices underscore the need for a dedicated BF mode, which could help overcome these limitations and further enhance the analyzer’s overall performance. We recommend caution in clinical interpretation and highlight the need for the development of a dedicated BF mode and some software modifications to improve analytical performance.
REFERENCES
- Hussong JW, Kjeldsberg CR. Kjeldsberg´s Body Fluid Analysis. Chicago, IL: ASCP Press; 2015.
- Comar SR, Machado NA, Dozza TG, Haas P. Análise citológica do líquido cefalorraquidiano. Estud Biol. 2009;31(73/75):93-102.
- Comar SR, Machado NA, Schulz T, França FS, Haas P. Análise citológica do líquido pleural no Hospital de Clínicas da Universidade Federal do Paraná (UFPR). Estud Biol. 2008;30(70/71R/72):17-25.
- Comar SR, Schulz T, Machado NA, França FS, Haas P. Análise citológica do líquido peritoneal. Estud Biol. 2010/2011;32/33(76-81):73-9.
- Comar SR, Siger GMB, Anghebem-Oliveira MI, Fronza AMS, Almeida SM. Líquido cefalorraquidiano – LCR. In: Barcelos LF, Aquino JL, editores. Tratado de análises clínicas. 1 ed. São Paulo: Editora Atheneu; 2018. p. 167-197.
- Haas P, Colturato PL, Comar SR. Líquidos cavitários ou líquidos serosos. In: Barcelos LF, Aquino JL, editores. Tratado de análises clínicas. 1 ed. São Paulo: Editora Atheneu; 2018. p. 221-256.
- Cognialli RCR, Comar SR, Souza AM, Singer GMB. Evaluation of pleural and ascitic fluid analysis on the Sysmex XE-5000 hematology analyzer. J Bras Patol Med Lab. 2017;53(3):150-158.
- Woo KS, Jeong IH, An GD, Lim HH, Han JY. Performance evaluation of new Abbott Alinity hq hematology analyzer. Int J Lab Hematol. 2019;41(5):657-663.
- Slim CL, Wevers BA, Demmers MWHJ, Lakos G, Hoffmann JJML, Adriaansen HJ, Kooren JA, Storm H. Multicenter performance evaluation of the Abbott Alinity hq hematology analyzer. Clin Chem Lab Med. 2019;57(12):1988-1998.
- Bayraktar N, Topcu DI. User verification of Abbott Alinity HQ hematology analyzer Turk J Biochem. 2024;49(2):167-177.
- Van der Beken Y, Van Dalem A, Van Moer G, Segers E, Damiaens S, Hoffmann J, Lakos G, Jochmans K. Performance evaluation of the prototype Abbott Alinity hq hematology analyzer. Int J Lab Hematol. 2019;41(4):448-455.
- Abbott Alinity h-series operations manual. For use with the Alinity hq module and the Alinity hs module. Abbott Park, IL: Abbott Laboratories; 2019.
- Bottini PV, Garlipp CR, Nogueira BF, Pompeo DB, Souza MI. Performance evaluation of a new generation of automated analyzer for pleural and peritoneal fluids cytology. Clin Lab. 2018;64(10):1783-1786.
- Alcaide-Martín MJ, Altimira-Queral L, Sahuquillo-Frías L, Valiña-Amado L, Merino A, García-de-Guadiana-Romualdo L. Automated cell count in body fluids: a review. Adv Lab Med. 2021;2(2):149-177.
- Milevoj Kopcinovic L, Culej J, Jokic A, Bozovic M, Kocijan I. Laboratory testing of extravascular body fluids: National recommendations on behalf of the Croatian Society of Medical Biochemistry and Laboratory Medicine. Part I – Serous fluids. Biochem Med (Zagreb). 2020;30(1):010502.
- CLSI. Validation, Verification, and Quality Assurance of Automated Hematology Analyzers; Approved Standard—Second Edition. CLSI document H26-A2. Wayne, PA: Clinical and Laboratory Standards Institute; 2010.
- CLSI. Body Fluid Analysis for Cellular Composition; Approved Standard—Second Edition. CLSI document H56-A. Wayne, PA: Clinical and Laboratory Standards Institute; 2006.
- Bourner G, De la Salle B, George T, Tabe Y, Baum H, Culp N, Keng TB, and International Committee for Standardization in Hematology. ICSH guidelines for the verification and performance of automated cell counters for body fluids. Int J Lab Hematol. 2014;36(6):598-612.
- Broughton PM. Carry-over in automatic analysers. J Automat Chem. 1984;6(2):94-5.
- Fleming C, Brouwer R, Lindemans J, de Jonge R. Validation of the body fluid module on the new Sysmex XN-1000 for counting blood cells in cerebrospinal fluid and other body fluids. Clin Chem Lab Med. 2012;50(10):1791-8.
- Herroelen PH, Demeester S, Damiaens S, Evenepoel A, Jochmans K. Performance of Abbott Alinity hq hematology analyzer for automated cell counting of body fluids. Int J Lab Hematol. 2022;44(1):96-103.
- Danise P, Maconi M, Rovetti A, Avino D, Di Palma A, Gerardo Pirofalo M, Esposito C. Cell counting of body fluids: comparison between three automated haematology analysers and the manual microscope method. Int J Lab Hematol. 2013;35(6):608-13.
- Boldú L, Laguna J, Casanova A, García S, Molina A, Merino A. Serous body fluid evaluation using the new automated haematology analyser Mindray BC-6800Plus. Clin Chem Lab Med. 2022;60(11):1786-1795.
- Zimmermann M, Ruprecht K, Kainzinger F, Heppner FL, Weimann A. Automated vs. manual cerebrospinal fluid cell counts: a work and cost analysis comparing the Sysmex XE-5000 and the Fuchs-Rosenthal manual counting chamber. Int J Lab Hematol. 2011;33(6):629-37.
Correspondence
Samuel Ricardo Comar
E-mail: [email protected]